


Figure 2.
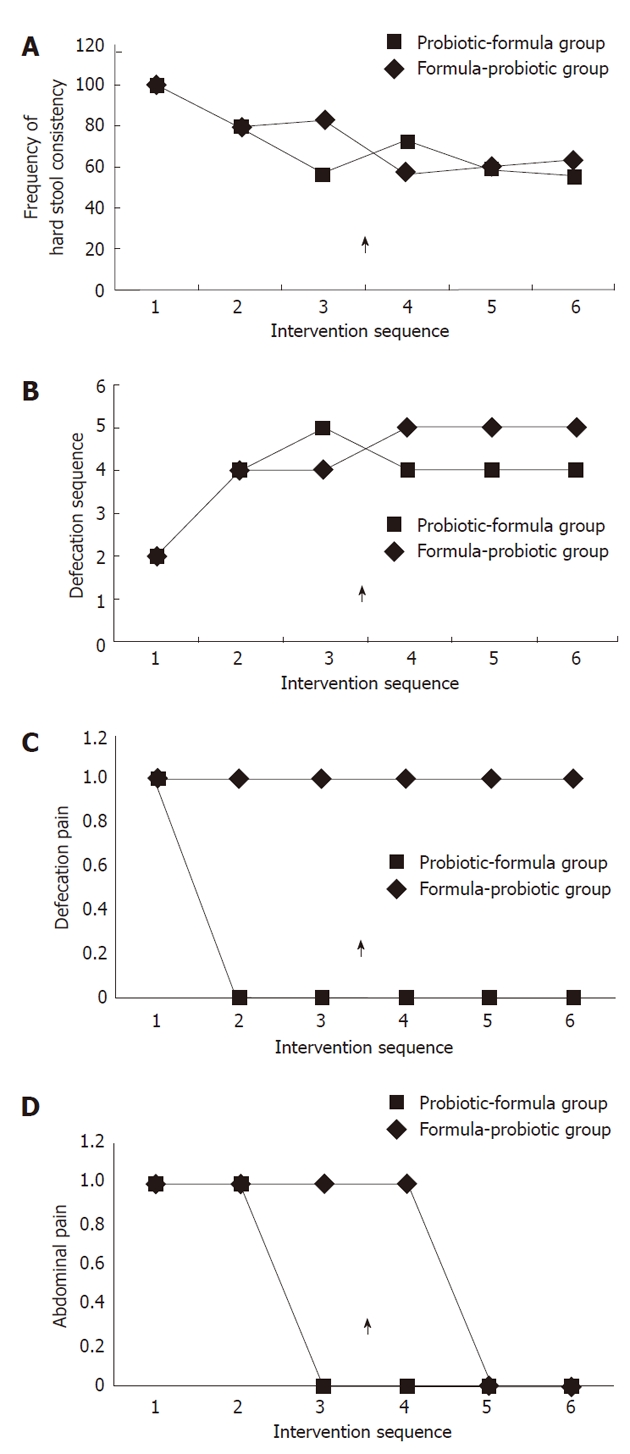
Evolution of hard stool consistency (Bristol scale < 4) (A), defecation frequency (B), defecation pain (C) and abdominal pain (D)during the intervention sequence. 1: A1; 2: A2; 3: A3; 4: B1; 5: B2; 6: B3. Arrow shows the moment of inversion in the intervention sequence.