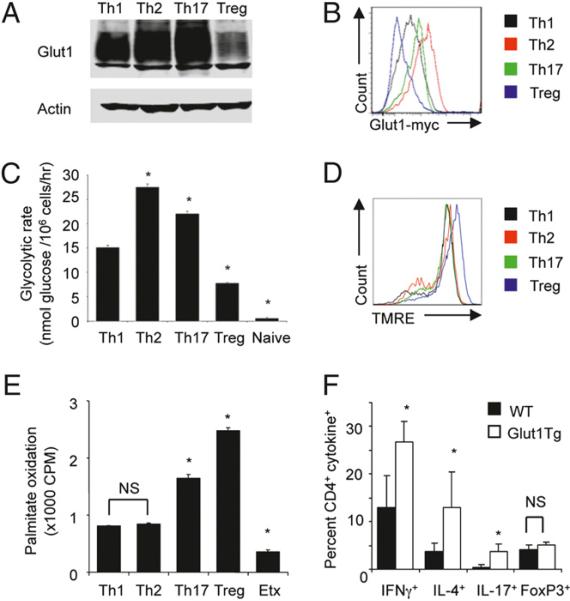
FIGURE 1.
Teff and Treg CD4+ T cell subsets exhibit distinct metabolic profiles. CD4+ T cells from wild-type (A, C–E) or Glut1-myc (B) knockin mice were cultured to enrich Teff (Th1, Th2, Th17) and Treg subsets. After 3 d, cells were washed and cultured 2 d in IL-2 alone and analyzed by immunoblot (A), surface staining of endogenous Glut1-myc (B) with anti-Myc Ab followed by gating on each T cell subset as determined by intracellular cytokine staining, glycolysis (C), mitochondrial potential by tetramethylrhodamine ethyl ester staining (D), and palmitate oxidation (E). Naive CD4+ T cells or cells activated in the presence of the CPTI inhibitor Etx are shown as controls. F, Percentage of splenic cytokine+ CD4+ T cells from >1 y aged Glut1 transgenic (n = 6) and nontransgenic (n = 5) mice following stimulation intracellular cytokine staining for IFN-γ, IL-4, and IL-17. The percentage of Foxp3+ cells was assessed ex vivo by intracellular staining. Results are from three independent experiments with average and SD determined using the Student t test. *p ≤ 0.05.

