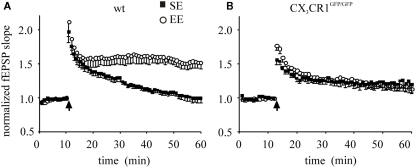
Figure 1.
CA1 plasticity of wt and CX3CR1GFP/GFP mice exposed either to SE or EE conditions. Points represent mean ± SEM. Of fEPSP slopes evoked every 20 s and normalized as detailed in the Section “Materials and Methods.” Arrows indicate time of application of HFS. (A) Enhancement of LTP in wt mice raised in EE: 45 min after HFS, EE wt mice (open circle) developed a robust LTP of fEPSP slope compared to that of mice raised in SE (dark square, p < 0.001). (B) In CX3CR1GFP/GFP mice LTP is enhanced and EE produced no effect: after HFS, the amplitude of fEPSP potentiation of EE CX3CR1GFP/GFP mice (open circle) is not different from that obtained in SE mice (dark square). Note that that basal LTP evoked in SE is increased in CX3CR1GFP/GFP mice compared to wt [in (A), p = 0.006].

