
FIG. 5.
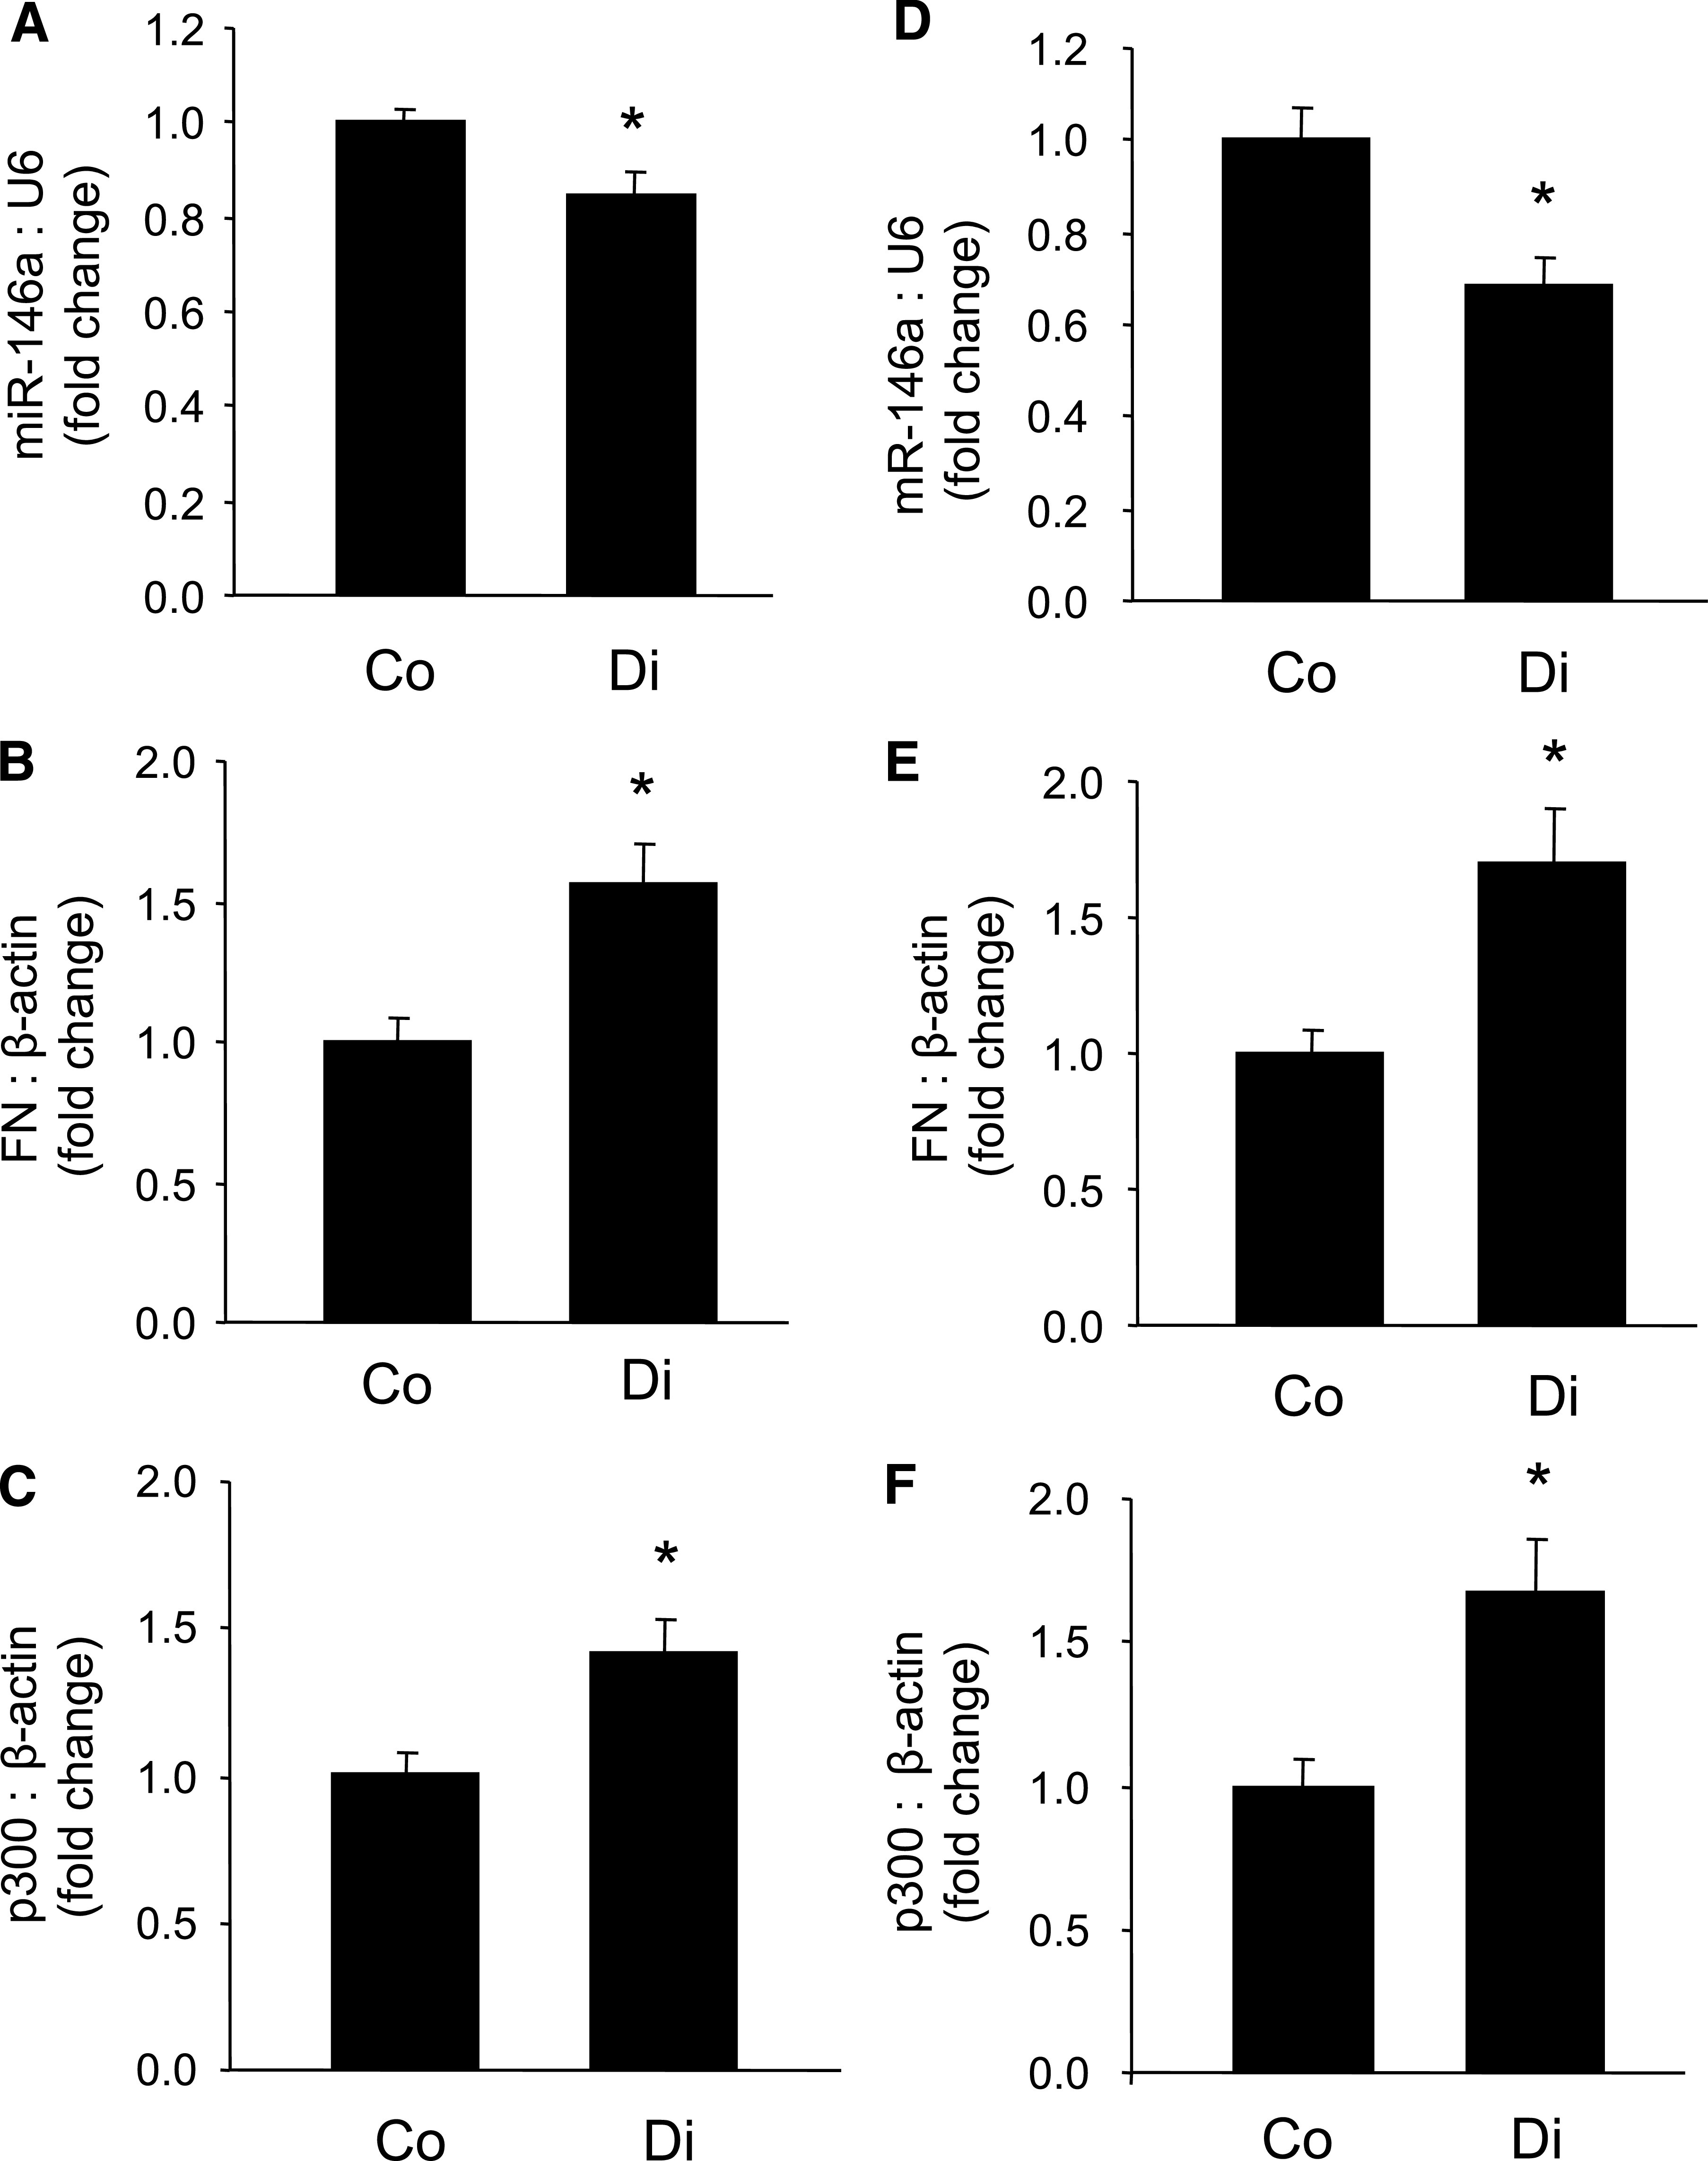
In the heart (left column) and kidneys (right column) of type 1 diabetic (STZ induced) rats, miR-146a levels were reduced (A and D) and FN mRNA (B and E) and p300 mRNA (C and F) levels were elevated after 1 month of poorly controlled diabetes (Di). *Significantly different from control (Co), miRNA levels are expressed as a ratio of RNU6B (U6) normalized to control; mRNA levels are expressed as a ratio to β-actin normalized to control.