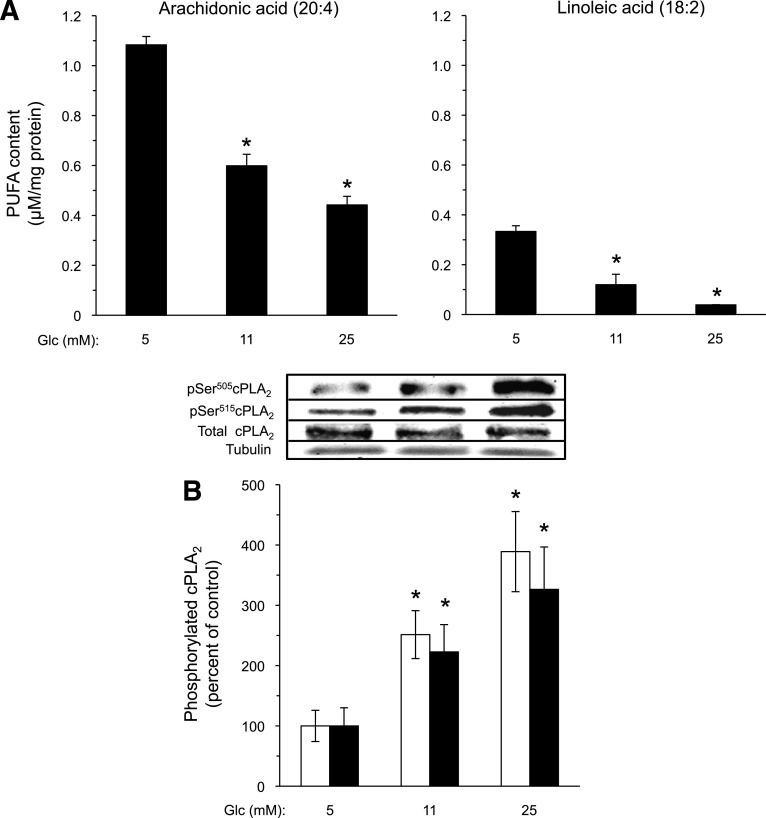
FIG. 1.
Effect of high glucose on AA and LA content in INS-1E cells. A: INS-1E cells were incubated with the indicated glucose (Glc) levels for 16 h and processed for analysis of fatty acid residues in membrane phospholipids. The absolute content of AA and LA in phospholipids of INS-1E cells exposed to 5, 11, and 25 mmol/L glucose was calculated as follows:  , where ASTD is the area of the standard reference of the fatty acid from the calibration run, CSTD is the concentration of the standard reference from the calibration run, Ax is the area of the compound (x) from the calibration run, Cx is the concentration of the compound (x) from the calibration run, Fx is the conversion factor of the compound (x), CGC is the concentration of the compound in the sample from the GC trial run, AGC is the area of the compound (x) obtained from the GC trial run, and MWx is the molecular weight of the compound (x). Results are mean ± SEM, n = 4. *P < 0.05 for the difference from the respective 5 mmol/L glucose values. B: Lysates were prepared from similarly treated INS-1E cells and taken for Western blot analysis of total cPLA2, pSer505-cPLA2 (white bars), and pSer515-cPLA2 (black bars). Representative Western blots are shown (inset). Tubulin was used for equal protein loading control. Results are mean ± SEM, n = 3. *P < 0.05 for the difference from the respective 5 mmol/L glucose control.

