FIG. 5.
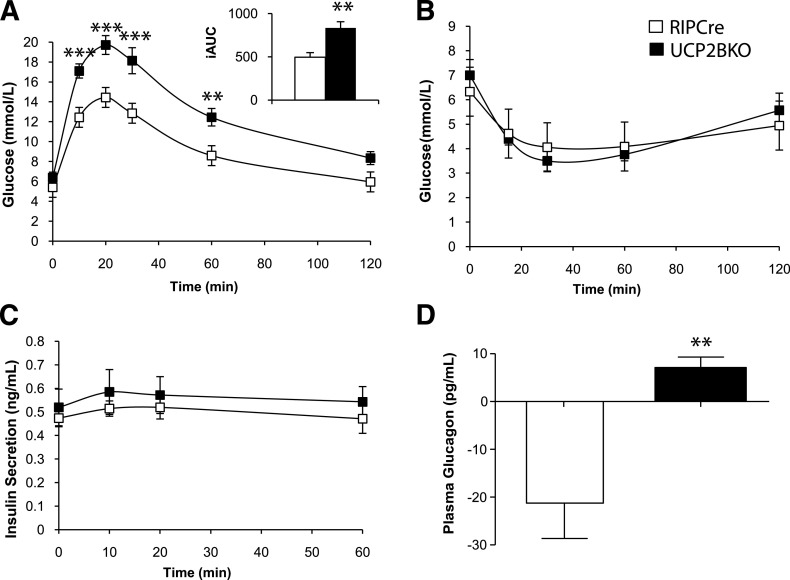
UCP2BKO mice are glucose intolerant. A: OGTTs in 12-week-old mice after an overnight fast. The inset shows the incremental area under the glucose curve (iAUC) B: ipITT in 13-week-old mice after a 4-h fast. C: Plasma insulin levels during the OGTT. D: The change in plasma glucagon levels during the first 10 min of the OGTT. Blood samples were taken at 0 and 10 min after glucose gavage, and the change in plasma glucagon level over 10 min was calculated. n = 8–15 mice per genotype. **P < 0.01, ***P < 0.001. The error bars show the SEM.

