
FIG. 1.
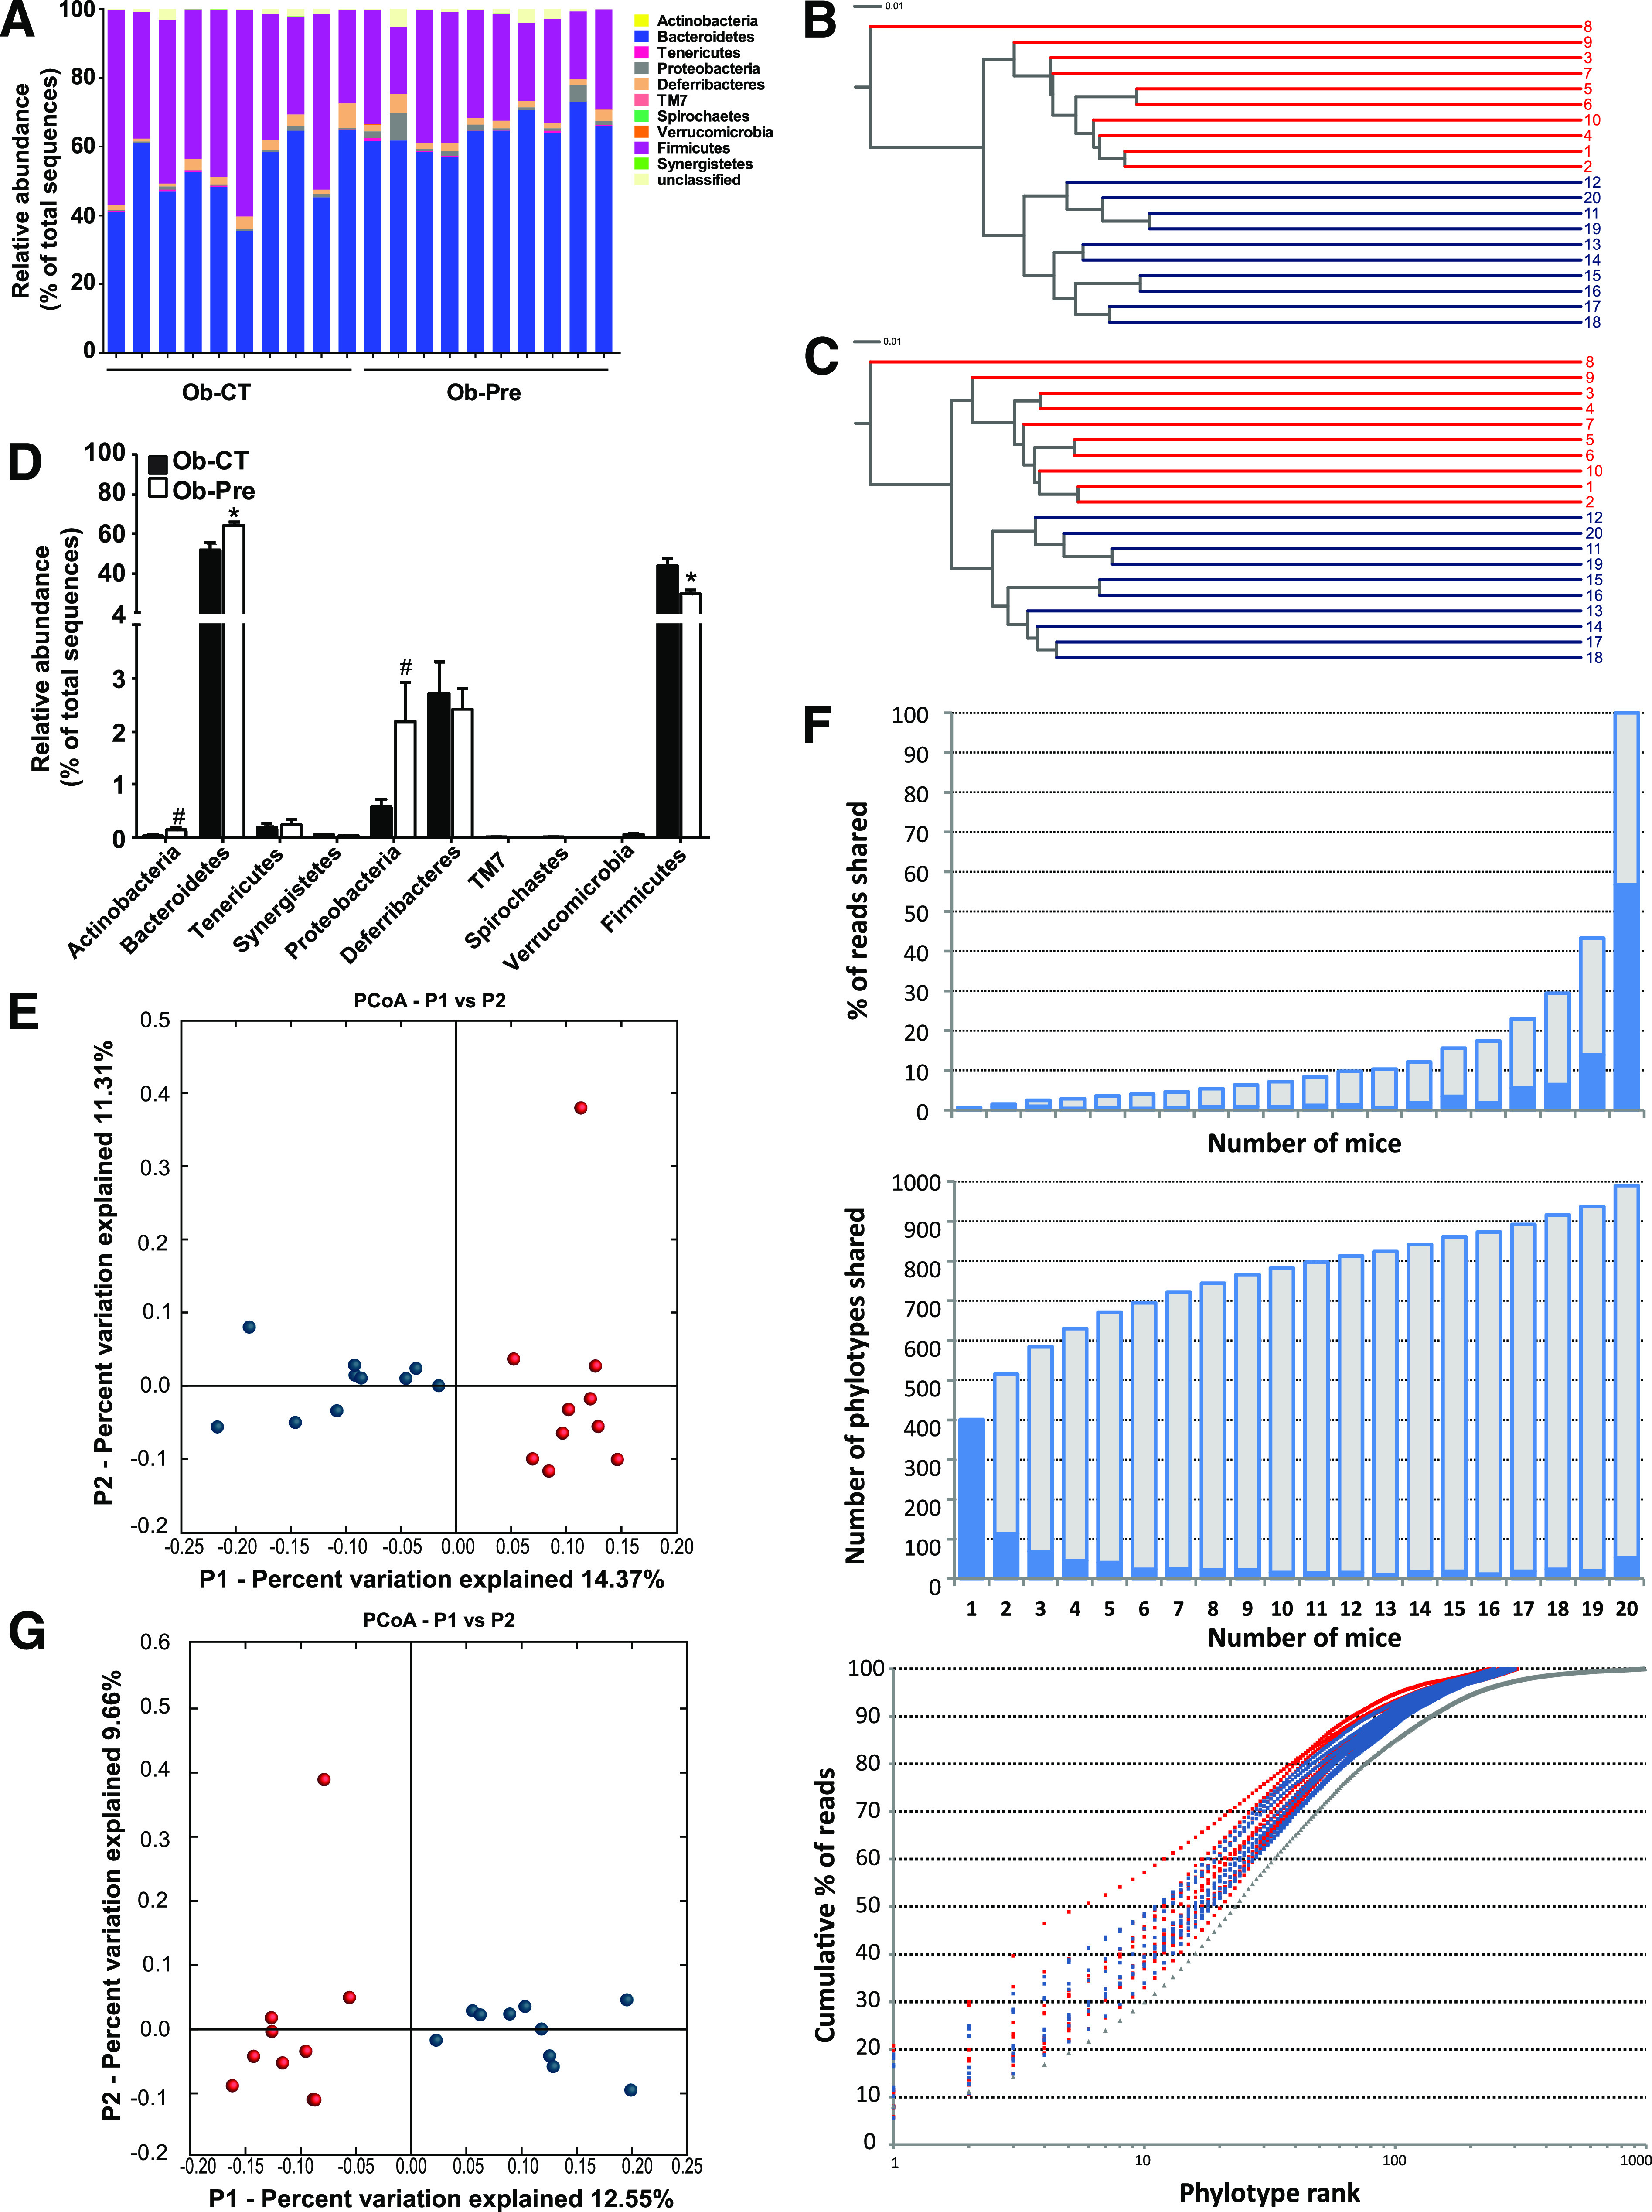
Analysis of the gut bacterial community by 16S rRNA pyrosequencing from obese mice on standard chow and prebiotic diets. A: Percentage of each community contributed by the indicated phyla. B: Clustering of mice cecal microbial communities in the two tested groups based on the unweighted UniFrac analysis and 97% ID phylotypes or (C) 100% ID phylotypes. Red corresponds to the standard chow diet (Ob-CT), and blue corresponds to the prebiotic diet (Ob-Pre). Branch length represents distance between environments in UniFrac units, indicated by the scale bar. D: Relative abundance of different phyla expressed as the percentage of total sequence reads. Mean ± SEM. n = 10 mice/group. *P < 0.05; #P < 0.1, determined by a two-tailed Student t test. PCoA based on the unweighted (presence/absence) UniFrac analysis and (E) 97% ID phylotypes or (G) 100% ID phylotypes. Each circle representing a single sample is colored according to the dietary conditions; red corresponds to Ob-CT and blue corresponds to Ob-Pre. F: Number of 97% ID phylotypes shared among a given number of mice (middle panel) and their corresponding abundance expressed as the percentage of total reads (top panel) indicated by blue bars. Cumulative data are indicated in gray. The bottom panel shows the relative abundance of 97% ID phylotypes, in which the x-axis indicates individual phylotypes ranked according to their relative abundance from high to low, and the y-axis indicates the cumulative abundance (the percentage of total reads). Gray triangles correspond to a pooled data set from 20 mice.