
FIG. 2.
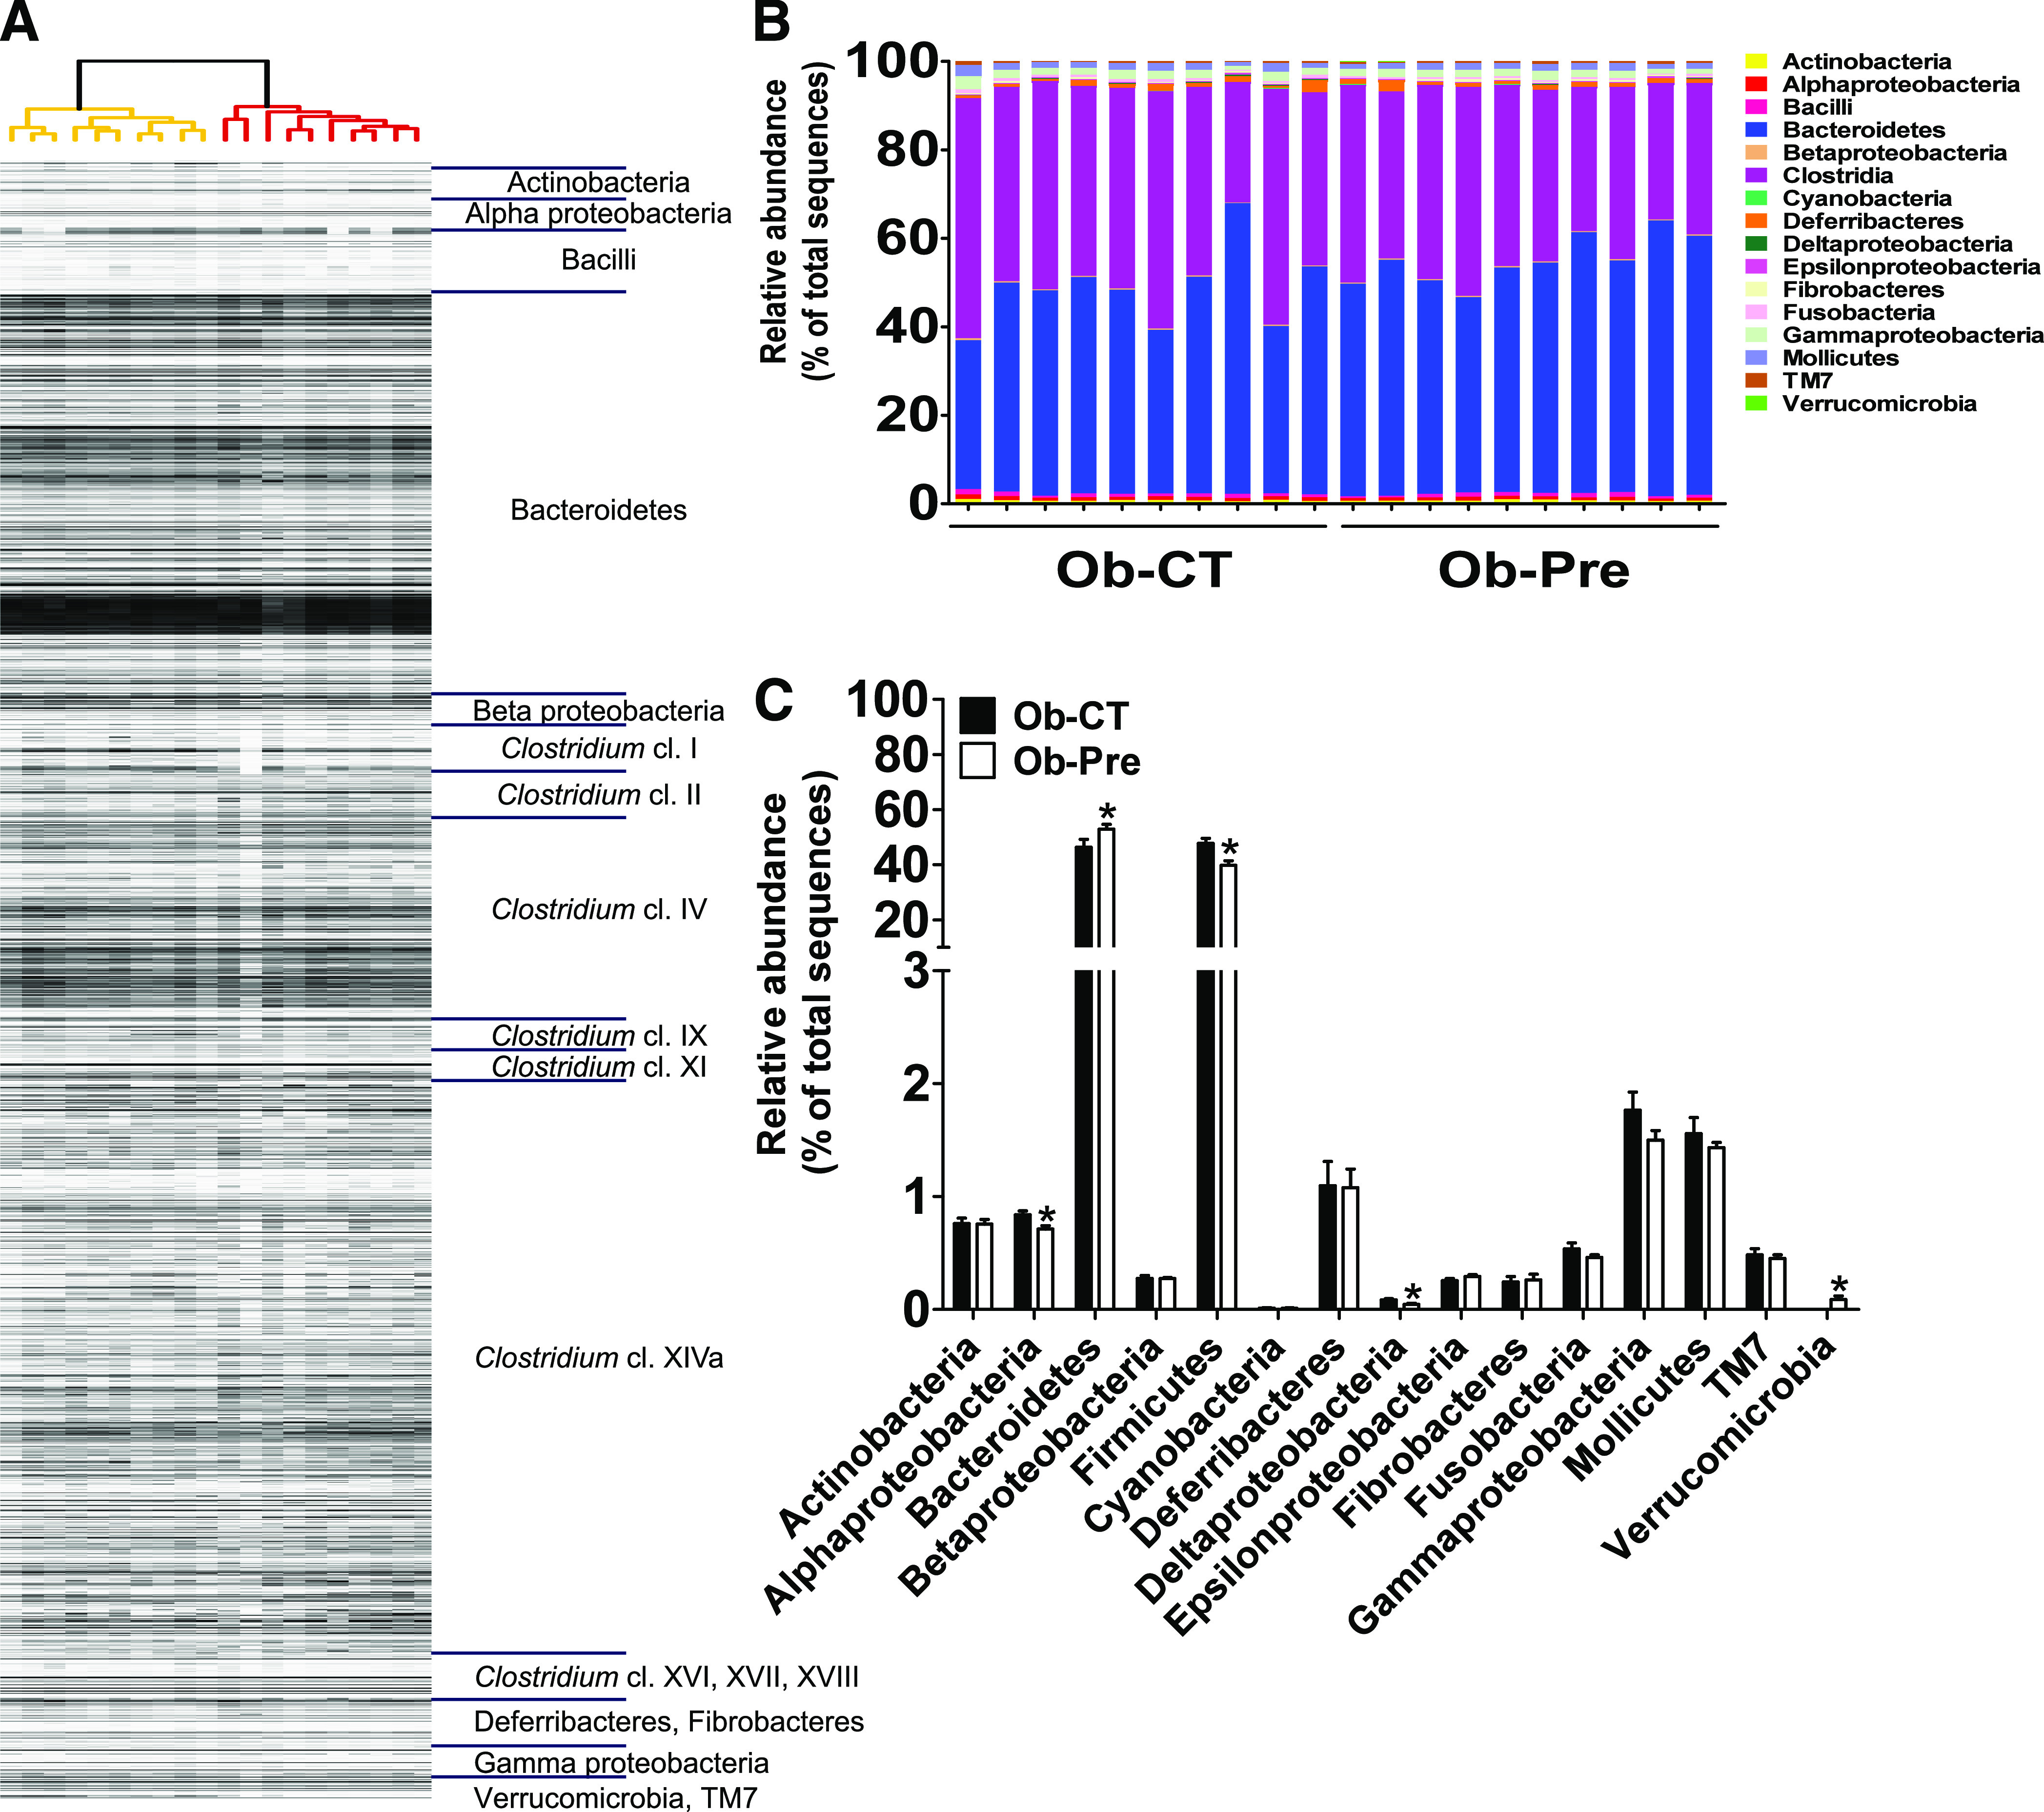
Phylogenetic microarray analysis of gut bacterial community from the Ob-CT and the Ob-Pre mice. A: Clustering of the MITChip phylogenetic fingerprints of the gut microbiota from the cecal content of the Ob-CT and the Ob-Pre mice (n = 10/group). The highest phylogenetic level of specificity of probes (level 1) is depicted on the right. B: Percentage of each community contributed by the indicated taxa. C: Relative abundance of different taxa expressed as the percentage of total sequence reads. Mean ± SEM. n = 10 mice/group. *P < 0.05, determined by a two-tailed Student t test.