
FIG. 5.
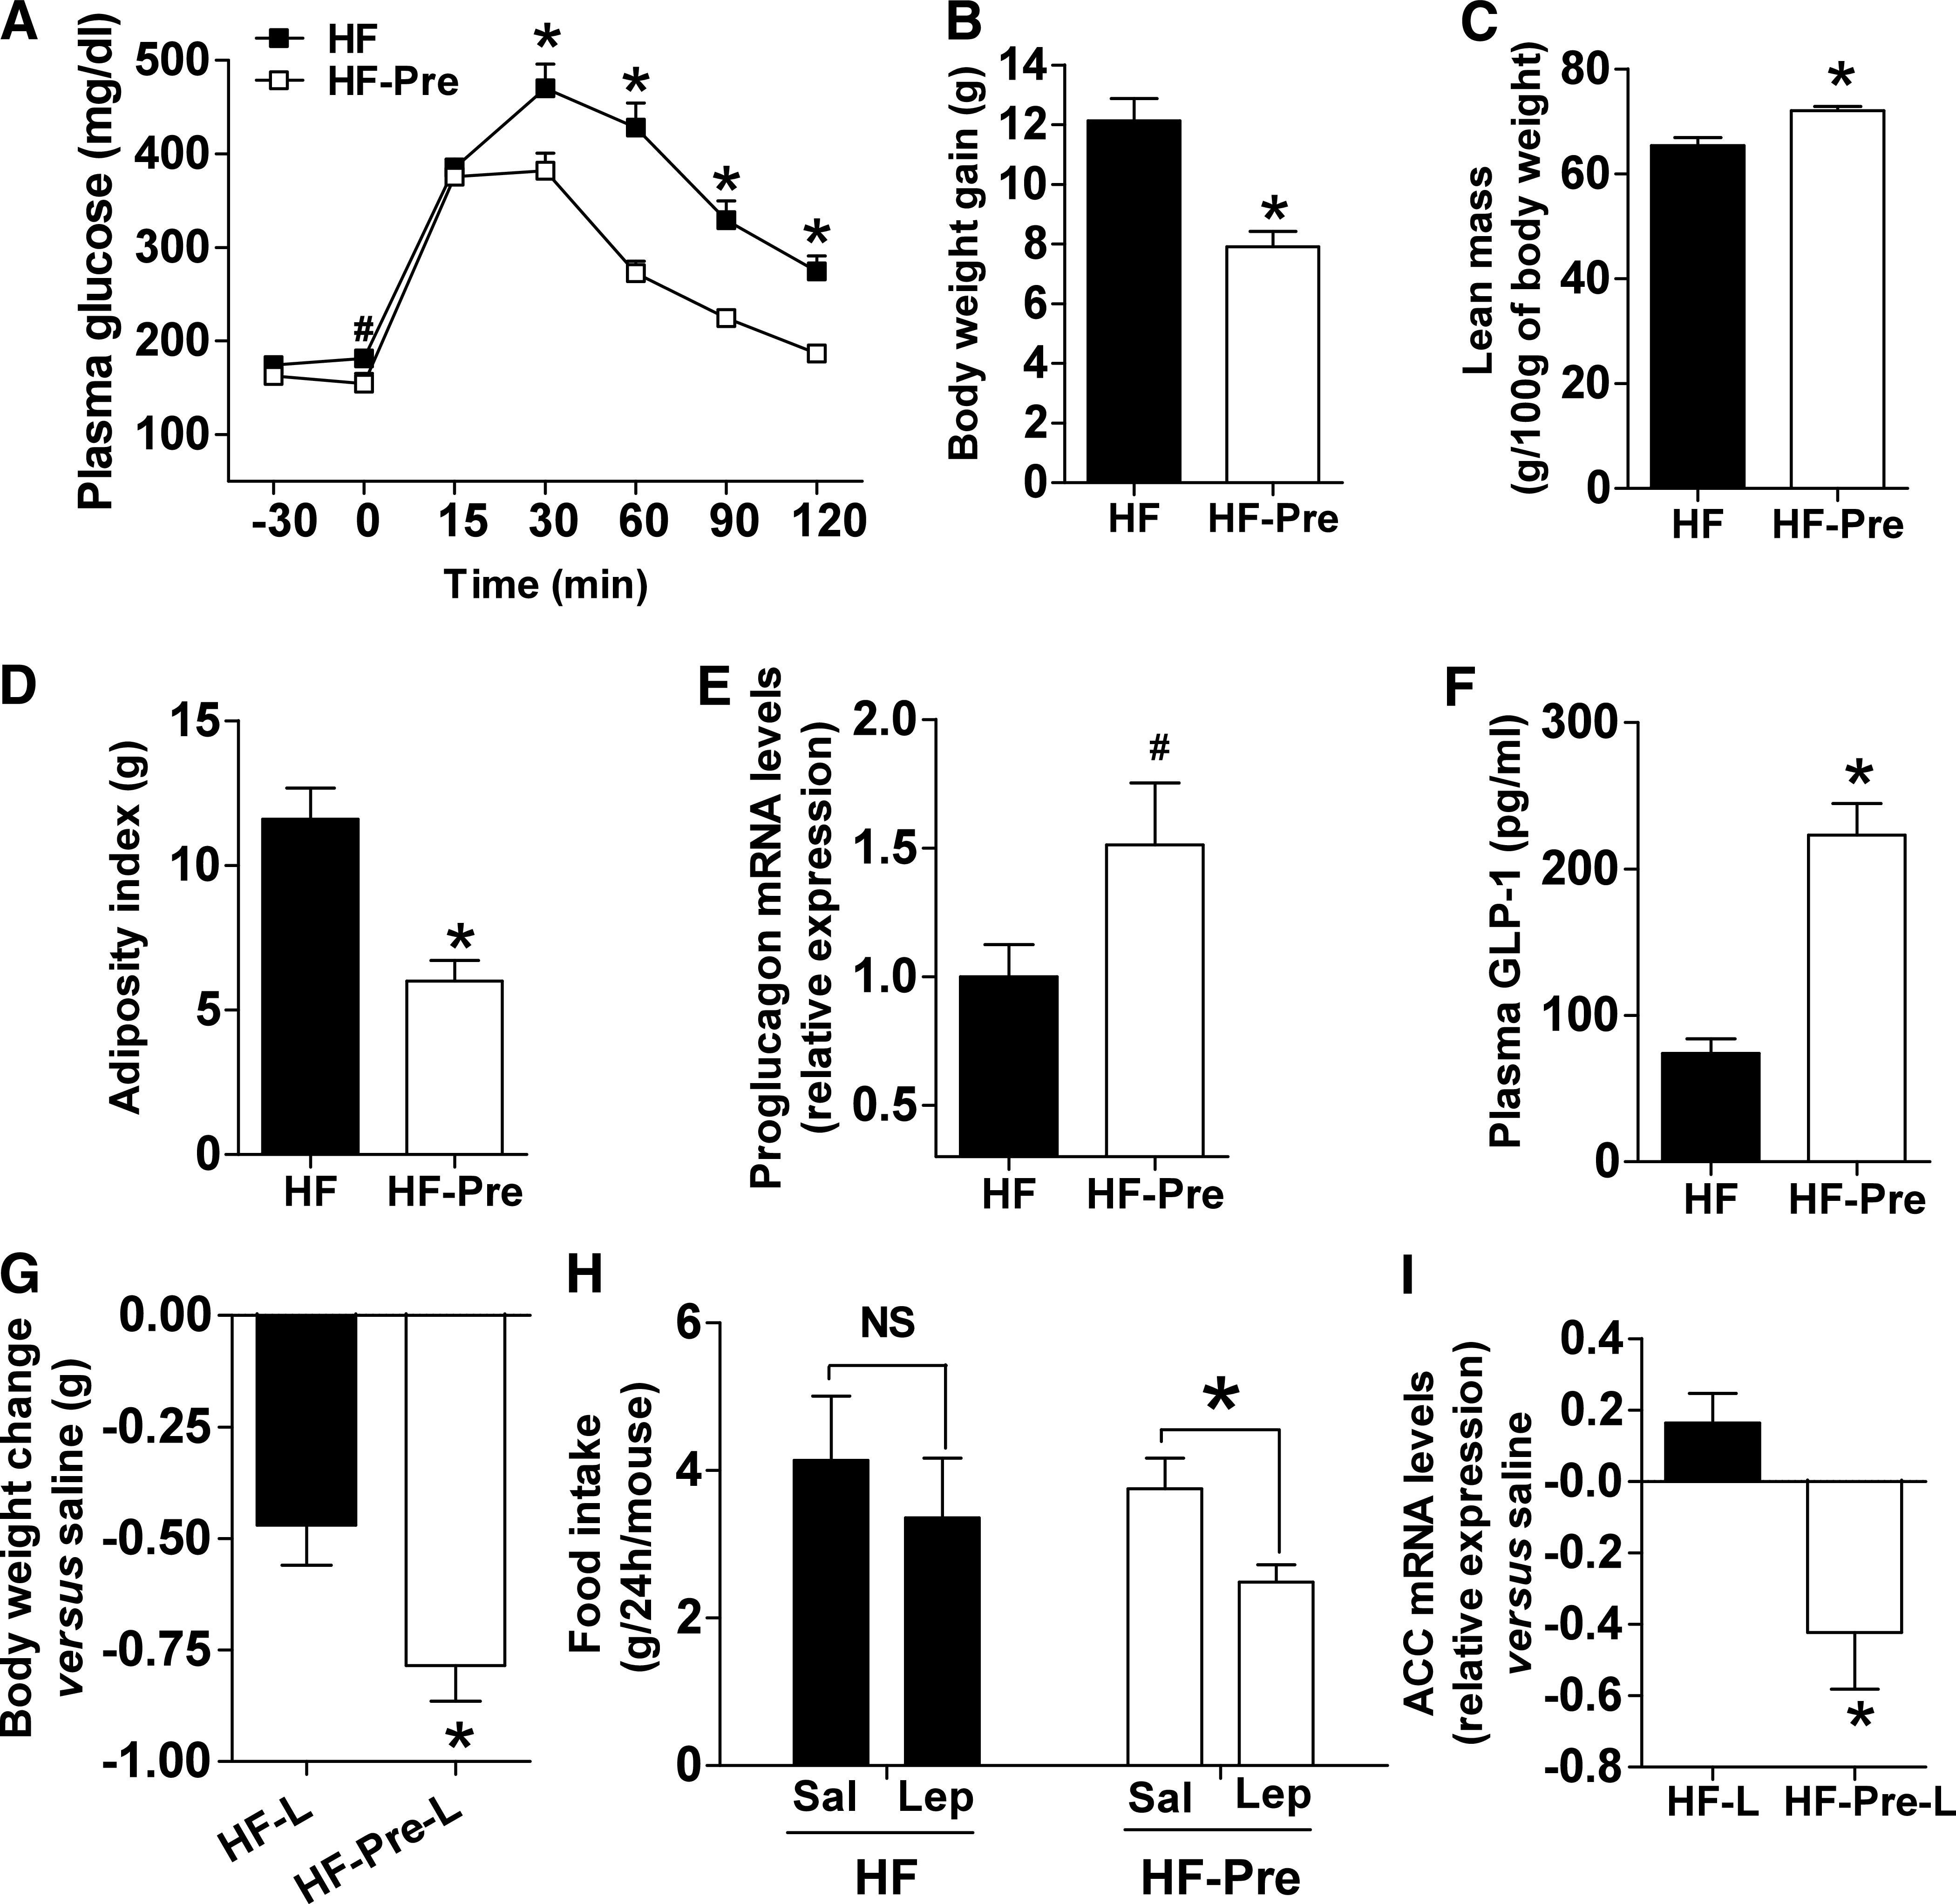
Prebiotic-induced changes in gut microbiota are associated with improved leptin sensitivity and glucose homeostasis in diet-induced obese and diabetic mice. A: Plasma glucose profile after 2 g/kg glucose oral challenge in freely moving mice in the HF (■) and the HF-Pre (□) mice. B: Body weight gain. C: Lean body mass measured by nuclear magnetic resonance. D: Adiposity index, corresponding to the sum of the subcutaneous, the visceral, and the epididymal adipose depot weights. E: Colon proglucagon mRNA expression. F: Portal plasma GLP-1 level content. Mean ± SEM. n = 8 (HF) and 9 (HF-Pre). *P < 0.05; #P = 0.08, determined by a two-tailed Student t test. G: Body weight changes 2 days after twice-daily intraperitoneal leptin (0.375 mg/kg) in the HF (HF-L) and the HF-Pre mice (HF-Pre-L). Data from each group were normalized to their own paired saline control. Mean ± SEM. n = 10 mice/group. *P < 0.05, determined by a two-tailed Student t test. H: Food intake 24 h after two doses of intraperitoneal leptin (Lep) (0.375 mg/kg). Data from each group are compared with their own paired saline control (Sal) vs. leptin. Mean ± SEM. n = 10 mice/group. *P < 0.05, determined by a paired Student t test. I: Adipose tissue acetyl-CoA carboxylase (ACC) mRNA expression 6 h after intraperitoneal leptin (1 mg/kg) or saline in the HF (HF-L) and the HF-Pre mice (HF-Pre-L). Data from each group were normalized to their own saline control. Mean ± SEM. Saline, n = 4 mice/group; leptin, n = 6 mice/group. *P < 0.05, determined by a two-tailed Student t test.