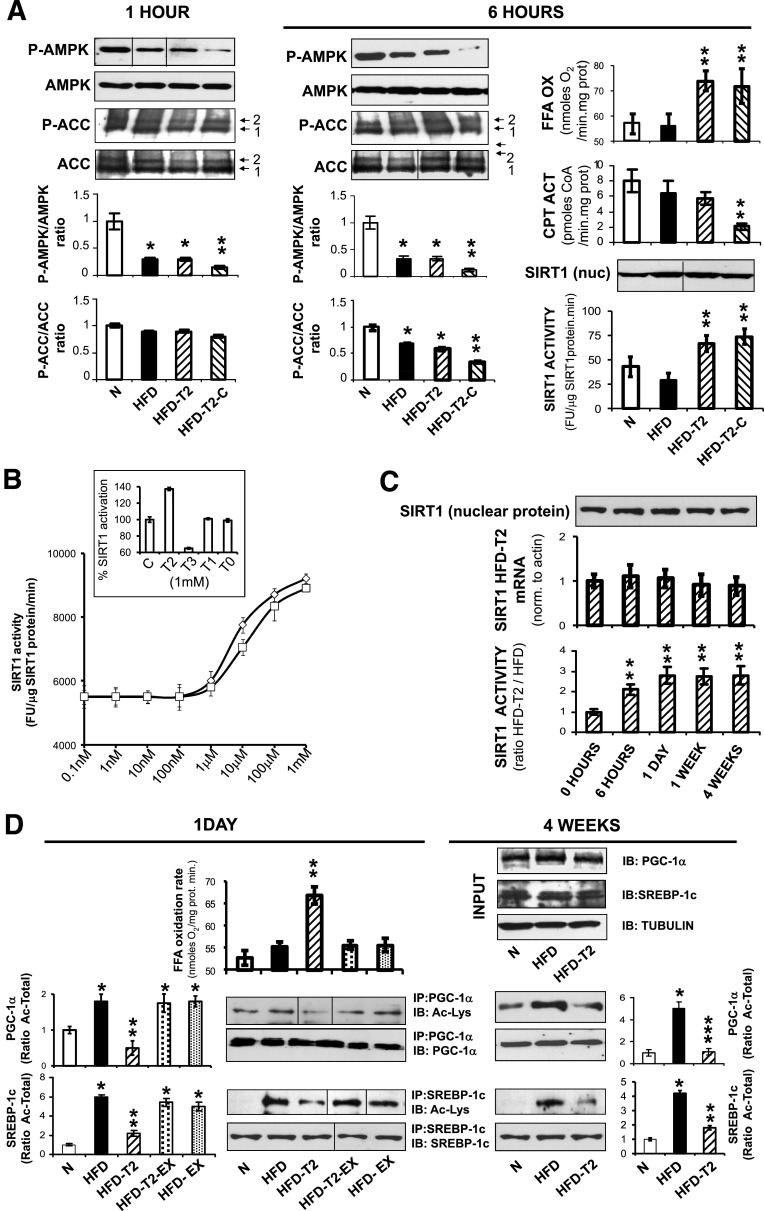
FIG. 3.
Hepatic induction of fatty acid oxidation by T2 in HFD animals does not involve AMPK but is associated with SIRT1 activation. A: Compound C effectively inhibits AMPK Thr172 and ACC Ser79 phosphorylation within 1 and 6 h, respectively, of its simultaneous administration with T2. Positions of ACC isoforms 1 and 2 are indicated at the right. The increase of fatty acid oxidation persisted at 6 h after injection of T2 plus Compound C. SIRT1 nuclear protein activity increased at 6 h after injection of T2 and was not inhibited by Compound C. B: T2 is a specific activator of SIRT1. The effects of T2 and RSV (positive control) were compared using a fluorescence-based deacetylation assay (x-axis: logarithmic scale). Inlay: Other tested TH metabolites either inhibit SIRT1 activity (T3) or are ineffective (T1, T0). C: T2 induces prolonged activation of SIRT1. Upper: Nuclear SIRT1 protein. Middle: mRNA levels in livers of animals treated as indicated underneath the bars. Lower: Hepatic nuclear SIRT1 activity. Ratios are shown for values from HFD-T2 animals over those from HFD animals at the indicated time points. D: T2 treatment causes deacetylation of SIRT1 target proteins, consistent with increased fatty acid oxidation. Left panel: Mitochondrial fatty acid oxidation in HFD or HFD-T2 animals treated for 1 day (left panel) in the presence or absence of the specific SIRT1 inhibitor EX-527 (EX). Left and right panel: In the same animals, as well as in animals treated for 4 weeks, hepatic nuclear extracts (2 mg) were immunoprecipitated with an anti–PGC-1α (upper) or anti–SREBP-1c antibody (lower) and analyzed with anti-acetyllysine antibody vs. PGC-1α or SREBP-1c. Numbers indicate the ratio acetylated over total protein. Upper right panel: No variation in total PGC-1α, SREBP-1c, and tubulin (control) protein levels in nuclear extracts between N, HFD, and HFD-T2 animals (input). A, C, and D: Representative blots are shown. D: Dividing lines indicate omissions/rearrangements of lanes from the same gel. Error bars represent SEM. *P < 0.05 vs. untreated controls; **P < 0.05 vs. both untreated controls and HFD-fed groups. □, N; ■, HFD; ▨, HFD-T2; ▧, HFD-T2–Compound C; dotted bars, HFD-T2-EX-527; light dotted bars, HFD-EX-527. B: ◇, RSV; □, T2. FFA, free fatty acid; FU, fluorescence units; IP, immunoprecipitated; IB, immunoblotted.

