Figure 6.
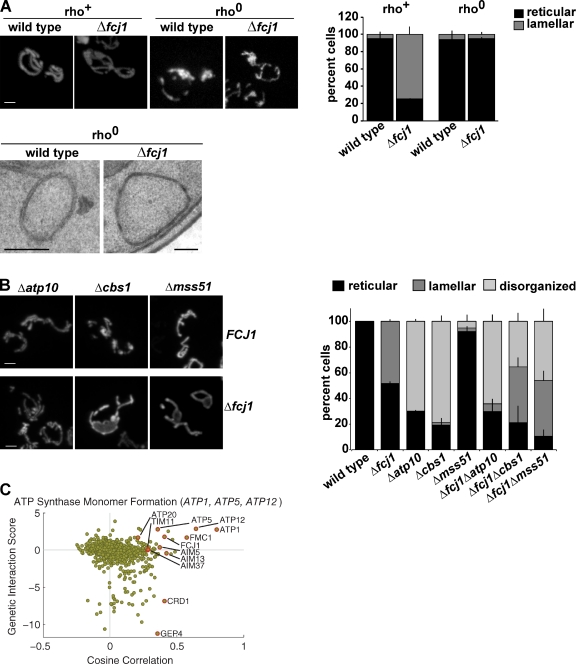
MitOS and ATP synthase dimers function in concert to control inner membrane structure. (A) Wild-type and Δfcj1 strains with (rho+) or without (rho0) mtDNA expressing matrix-targeted GFP were visualized by light microscopy (top). Representative images are shown. The graph represents quantification of the mitochondrial morphology of the indicated strains. Data are represented as the mean ± standard error of three independent experiments characterizing the mitochondrial morphology of ≥75 cells in each replicate. Rho0 wild-type and Δfcj1 strains were analyzed by EM as described (bottom). Representative images are shown. (B) Indicated strains expressing matrix-targeted GFP were grown in SD-dextrose and visualized by light microscopy. Representative images are shown. Bar, 2 µm. The graph represents quantification of the observed mitochondrial morphology of the indicated strains. Data are represented as the mean ± standard error of three independent experiments (error bars) characterizing the mitochondrial morphology of ≥75 cells in each replicate. (C) Genetic connection scatter plot generated for ATP1, ATP5, and ATP12 as described in Fig. 2 C. Bars: (A, top) 2 µm; (A, bottom) 200 nm; (B) 2 µm.

