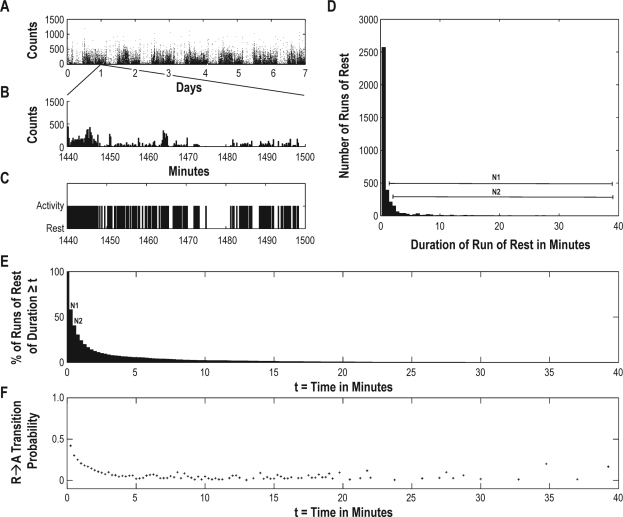
Figure 1.
Determination of pRA(t) for an illustrative participant. (A) 7 days of raw actigraphic data. (B) Enlarged extract of 1-h of data from panel A. (C) Assignment of epochs as rest/activity based on a threshold of 0 counts. (D) Histogram of durations of the rest bouts. (E) Number of runs of duration greater than or equal to t for t = 1…tRmax. The values of N1 and N2 as plotted in panel E are the areas under the curve in panel D from times 1 and 2 onward, respectively as indicated by the black lines in panel D. (F) pRA(t) as estimated from panel E using equations (1) and (2) in the text.

