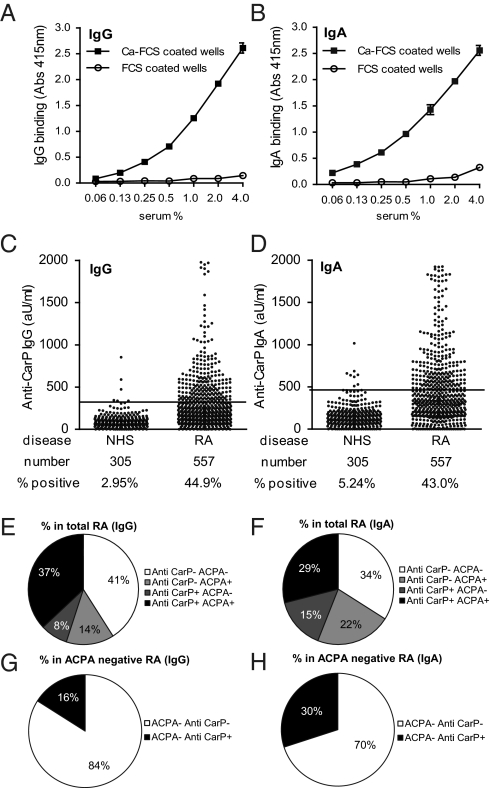
Fig. 5.
Anti-CarP IgG and IgA antibodies are present in RA sera. (A and B) Dose-response curves of the anti-CarP antibody-positive standard (IgG and IgA) on Ca-FCS and FCS in ELISA. (C and D) ELISA was performed for the detection of anti-CarP IgG and IgA in sera of healthy controls (NHS) and RA patients. A cut-off was established using the mean plus two times the SD of the healthy controls, as described in the Materials and Methods. Reactivity is depicted as arbitrary units per milliliter. The number of samples tested and the percentage of positivity is indicated below the graph. (E and F) Pie charts showing the percentage of RA patients positive and negative for anti-CCP2 and anti-CarP antibodies. (G and H) Pie charts showing the percentage of anti-CarP IgG- or IgA-positive patients negative for anti-CCP2.

