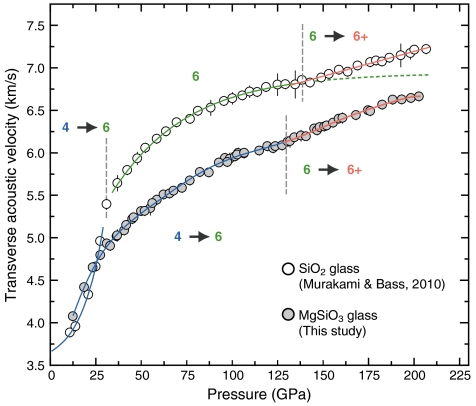
Fig. 2.
Transverse acoustic wave velocities of MgSiO3 glass (gray circles) as a function of pressure up to 203 GPa. The white circles indicate the results on SiO2 glass by Murakami and Bass (16). The velocity trajectories for the distinct pressure regimes are shown as blue, green, and orange lines with increasing pressure. Numbers indicate the potential Si-O coordination number within each pressure regime. Approximate pressure boundary for each Si-O coordinated structure are shown as the vertical dot lines. Error bars are ± 1σ from mean.

