Fig. 1.
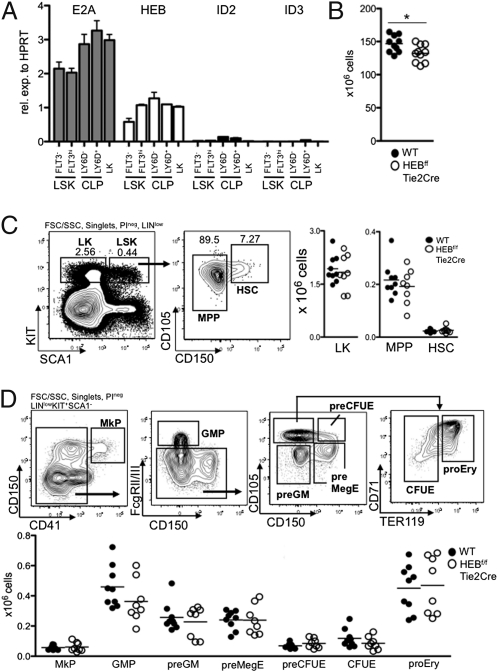
HEB is expressed in bone marrow progenitors. (A) Indicated FACS-sorted progenitor populations were analyzed by real-time PCR for the abundance of E2A, HEB, Id2, and Id3 mRNA. Values were normalized to hypoxanthine guanine phosphoribosyl transferase (HPRT) expression and are shown as mean ± SEM using purified mRNA from two independent sorts. (B) Absolute numbers of bone marrow cells (from femurs, tibias, and cresta iliac) of sex- and age-matched WT and HEBf/fTie2Cre mice. Each dot represents the number from a single mouse. The horizontal lines indicate the mean in each group. The asterisk indicates a P value < 0.05. C Left represents FACS plots of the gating strategies used to identify LK, MPP, and HSC populations. Lineage (LIN) includes CD11B, GR1, CD3ε, and NK1.1. C Right displays the absolute cell numbers of each population in WT and HEBf/fTie2Cre mice. Each dot represents the number from a single mouse, and the horizontal lines are the mean in each group. Data shown are pooled from two independent experiments. D Upper shows representative FACS plots of the gating strategy to identify erythromyeloid progenitor populations within the LK population. D Lower shows the absolute cell number of each population in WT and HEBf/fTie2Cre bone marrow. Each dot represents the number from a single mouse, and the horizontal lines are the mean in each group. Data shown are pooled from two independent experiments. MkP, megakaryocyte progenitor; GMP, granulocyte macrophage progenitor; preGM, pregranulocyte macrophage; preMegE, premegakarycocyte erythrocyte; preCFUE, pre-CFU erythrocyte; CFUE, CFU erythrocyte; proEry, proerythrocyte.

