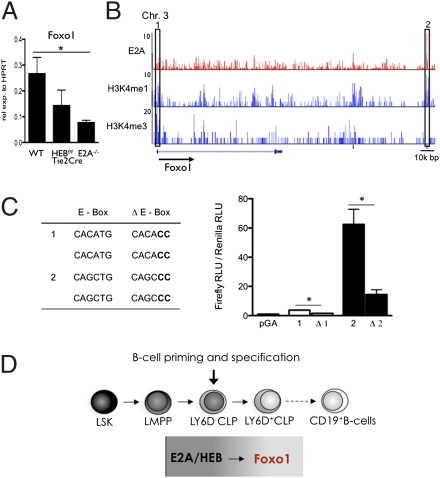
Fig. 5.
Direct regulation of Foxo1 expression in CLPs by the E proteins. (A) LY6D− CLPs from WT, HEBf/fTie2Cre, and E2A−/− mice were analyzed by real-time PCR for the abundance of Foxo1 mRNA. Values were normalized to HPRT expression and are shown as mean ± SEM using purified mRNA from two independent sorts. (B) E2A (red; top row) occupancy, H3K4me1 (blue; middle row), and H3K4me3 (blue; bottom row) epigenetics mark across the Foxo1 locus in EBF1-deficient cells identified by ChIP followed by genome-wide deep sequencing. Numbers on the left indicate the number of tags observed. The box on the left indicates a Foxo1 locus promoter region with E-box sites; the box on the right indicates a region where E2A occupancy is associated with H3K4me1. (C) Transcriptional activity of H3K4me1 islands (corresponding to the boxes in B) with associated E2A occupancy and presence of E boxes. Δ, deletion within the E-box sequences. Data shown are the mean ± SEM derived from two independent experiments. *P < 0.05. (D) Schematic diagram depicting B-cell development and the activities of E2A and HEB in B-cell specification.

