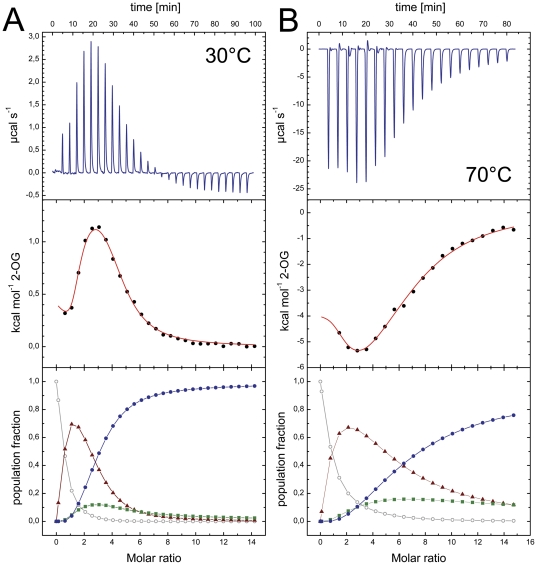
Figure 6. 2-OG binding to Af-GlnK3 and temperature dependence.
A) A titration at 30°C shows an initial endothermic event indicating an entropy-driven process that is followed by a strongly exothermic, enthalpy-driven event. In the analysis of population microstates (bottom panel) this translates to an initial accumulation of the singly occupied species (▴) due to negative cooperativity for the second site (▪), but strong positive cooperativity for binding the third ligand (•). Only singly or fully occupied binding sites will be present in relevant amounts. B) At 70°C the initial binding event becomes exothermic, leading to a very different overall shape of the experimental curve (top panel). However, analysis of the population microstates shows the same qualitative behavior as in (A).

