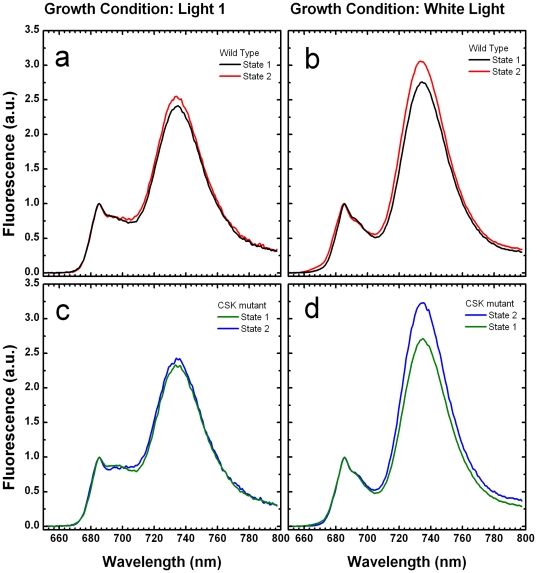
Figure 2. Fluorescence emission spectra of isolated thylakoids at 77 K.
77 K fluorescence emission spectra from wild type and CSK null mutant thylakoids as measured by the Perkin-Elmer LS 55 luminescence spectrometer. Figure 2a and 2c shows fluorescence emission spectra of thylakoids isolated from light 1 adapted plants. Figure 2b and 2d show fluorescence emission spectra of thylakoids isolated from white light grown plants. The excitation wavelength was 435 nm (5 nm slit width) and emission was detected from 650 to 800 nm (2.5 nm slit width). All spectra were normalized at 685 nm.

