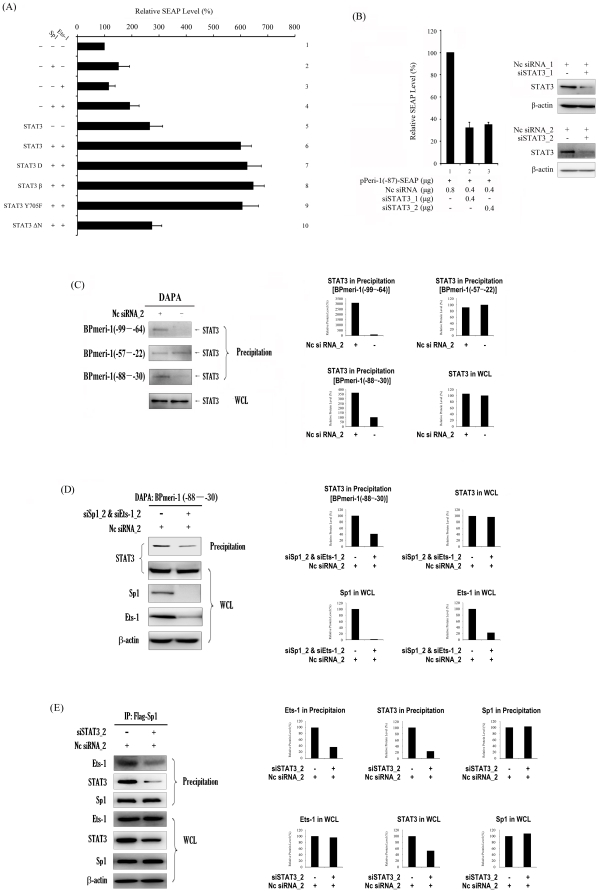
Figure 5. STAT3 bridges Sp1 and Ets-1 in the siRNA-stimulated meri-1 Promoter Activity.
(A) The siRNA-stimulated meri-1 promoter activity is further enhanced by overexpression of STAT3. By using various STAT3 mutants, the involvement of STAT3 was examined. The SEAP activity in the culture media of the CHO cells co-transfected with pPeri-1(−87)-SEAP and Nc siRNA_2 plus the indicating plasmids expressing Sp1, Ets-1, STAT3 and various STAT3 mutants. (B) Knockdown of STAT3 inhibits the siRNA-stimulated meri-1 promoter activity. The SEAP activity in the culture media of the CHO cells co-transfected with pPeri-1(−87)-SEAP and Nc siRNA plus siSTAT3_1 or siSTAT3_2 was measured. (C) STAT3 is recruited to the meri-1 promoter by hd-siRNA induction. Cell extracts of the CHO cells transfected with or without hd-siRNA were prepared. The aliquots were subjected to DAPA with biotinylated oligonucleotides that contained the Sp1-, Ets-1- or both Sp1- and Ets-1-binding sites in the meri-1 promoter (see Table 1). The precipitated complexes (Precipitation) were immunoblotted with anti-STAT3 antibody, and the whole cell lysates (WCL) were monitored for the expression of STAT3. The relative intensity of bands was quantified using the ImageGouge software. (D) STAT3 functions in the meri-1 promoter activity without DNA binding. Cell extracts of the CHO cells transfected with Nc siRNA_2, or with Nc siRNA_2 plus siSp1_2 and siEts-1_2 were prepared. The aliquots were subjected to DAPA with biotinylated Peri-1(−88–−30) oligonucleotides that contain the hd-siRNA elements in meri-1 promoter (see Table 1). (E) STAT3 functions as a bridge of Sp1 and Ets-1 in the hd-siRNA-stimulated meri-1 promoter activity. Cell extracts were prepared from the CHO cells co-transfected with pCMV-FLAG-Sp1 and Nc siRNA_2 plus siSTAT3_2 or not. Immunoprecipitation was performed using M2-anti-FLAG antibody-agarose beads. The immunoprecipitated pellets were analyzed by immunoblotting with anti-Ets-1 antibody. The relative intensity of bands was quantified using the ImageGouge software.

