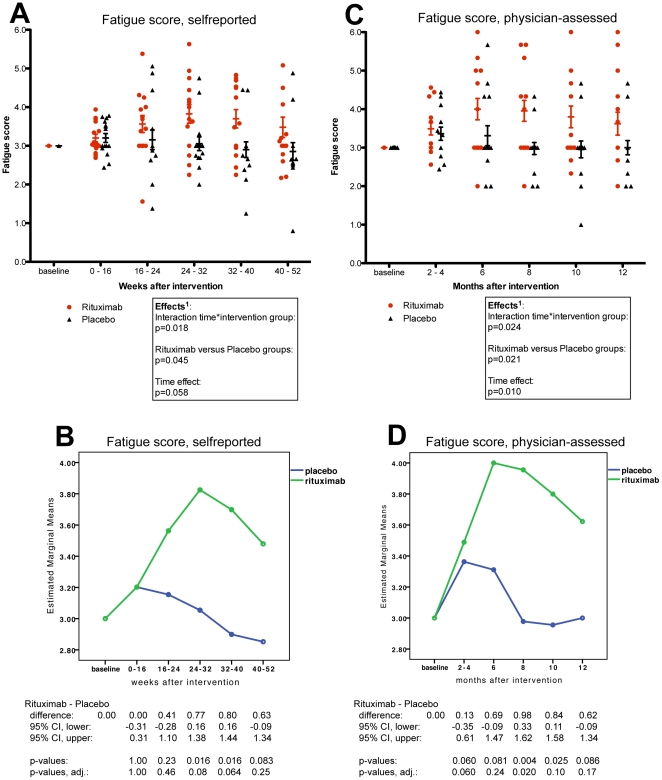
Figure 2. Fatigue scores in Rituximab and Placebo groups, self-reported and physician-assessed.
In panel A, the self-reported Fatigue scores were calculated for each patient every second week, from the mean of the four symptoms: Fatigue, Post-exertional exhaustion, Need for rest, Daily functioning. Then the mean values in Fatigue scores for the time intervals during follow-up were plotted. In panel C, the physician-assessed Fatigue scores were calculated from the mean of the same four symptoms, registered by the physician at the visits in the outpatient clinic. In panel B and D, estimated marginal means for self-reported and physician-assessed Fatigue scores during follow-up are shown. The scales on Y-axes were 0–6 (0: Major worsening; 1: Moderate worsening; 2: Slight worsening; 3: No change; 4: Slight improvement; 5: Moderate improvement; 6: Major improvement). The differences in distribution of Fatigue scores during follow-up, between the Rituximab and Placebo groups, were assessed by General Linear Model (GLM) for repeated measures, analysing the effects of time, the interaction time by intervention group, and the overall difference between intervention groups. Below panels C and D, the estimates for differences in mean Fatigue scores between the Rituximab and Placebo groups at the specific time intervals during follow-up, with 95% CI and p-values from the GLM (tests of within-subjects contrasts) are presented. In addition, Holm-Bonferroni step-down adjusted p-values for these time intervals are shown (five comparisons).

