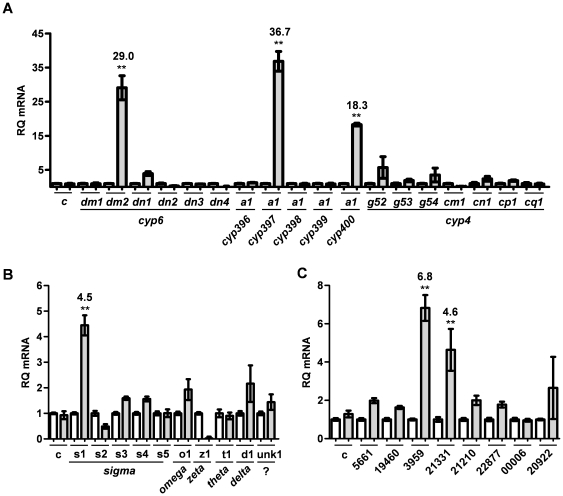
Figure 4. Relative expression of metabolic genes in Harlan and Richmond strain bed bugs.
Real-time quantitative PCR was performed to measure the relative expression levels of (A) P450, (B) GST, and (C) CE transcripts in the pyrethroid-resistant Richmond strain as compared with the susceptible Harlan strain. Each bar represents the mean of two biological replicates, each performed in triplicate. Error bars indicate the standard deviation from the mean. All samples were normalized to the expression of alpha-tubulin. A second control gene [myosin heavy-chain, indicated by (c)] was included to verify plate-to-plate consistency. Harlan (white) and Richmond (shaded) are indicated for each gene, with Harlan set to 1 for all samples. Fold change is indicated above each bar where 2-fold or greater for all statistically significant samples (** = p<0.01).

