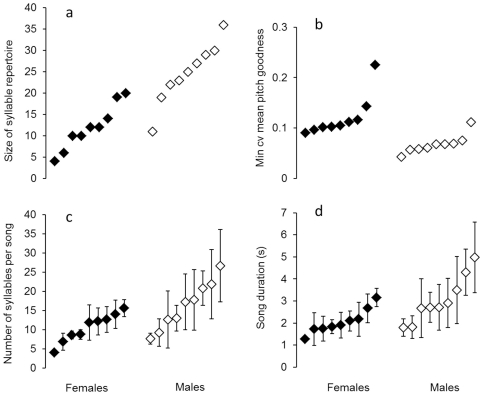
Figure 3. Song features that differed between female and male blue-capped cordon-bleus.
(a) size of syllable repertoire, (b) minimum coefficient of variation for mean pitch goodness, (c) number of syllables per song, (d) duration of song (s). For (a) and (b) single values per subject, for (c) and (d) individual means ± SD are displayed. Note that for each feature subjects are displayed in ascending order within their sex group. Filled symbols represent females, open symbols represent males. For statistics see Table 2.

