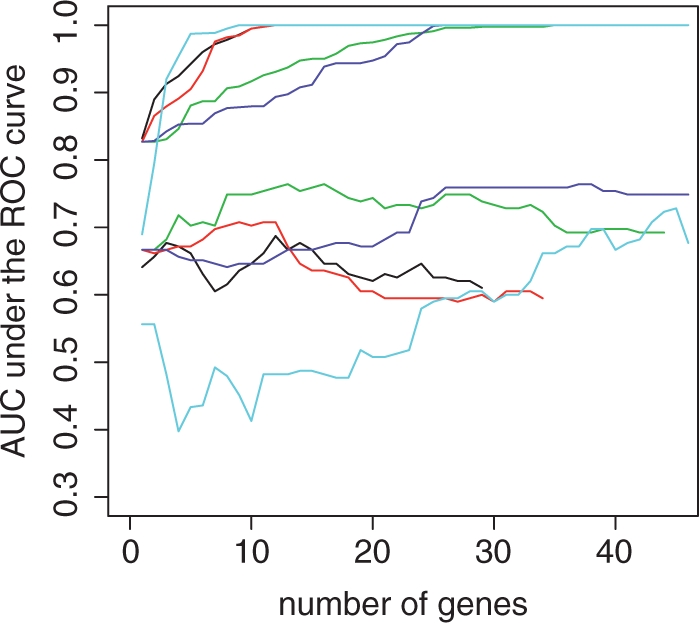
Fig. 5.

AUC of scores for differentiating the women having low and normal BMD. Thick lines: AUC in validation set; thin lines: AUC in training set; red: score based on M1(β); green: score based on M2(β); blue: score based on S(β); black: score based on logistic regression; cyan: score based on ada-boosting.
