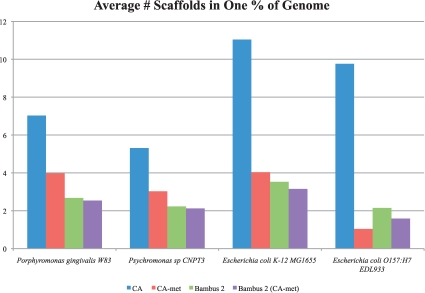
Fig. 5.
Assembly results for three simulated datasets. The y-axis represents the minimum number of scaffolds that add up to 1% of the genome size. Lower bars represent a better assembly. Bambus 2 produces large scaffolds for a wide range of coverage levels in our simulated datasets. Bambus 2 (CA-met) is Bambus 2 run using CA-met instead of using Minimus unitigs. We aligned the assembly (all contigs >2 kb) to the reference and counted coverage by reciprocal best matches over 95% identity. We use reciprocal best matches to avoid double counting Bambus 2 motifs that cover the same genomic region. We divide the number of scaffolds by the genome coverage and average the results, by genome, on all three simulated datasets to evaluate performance across varying coverage.

