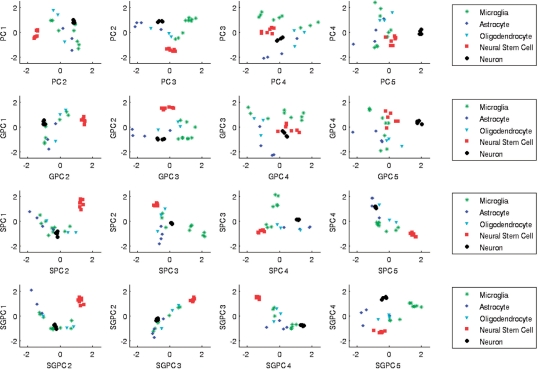
Fig. 1.
Scatter plots of normalized sample PCs for the neural cell types data. Results from PCA, GPCA, Sparse Non-Negative PCA (SPCA) and Sparse Non-Negative GPCA (SGPCA) are compared for the five neural cell types. Sparse methods (bottom rows) demonstrate clearer separation of samples from different cell types.

