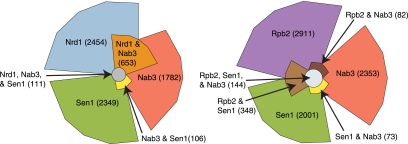
FIGURE 1.
Euler plots of cross-linked regions. (Left) Overlap between Nrd1, Nab3, and Sen1 cross-linked regions. (Right) Overlap between Rpb2, Sen1, and Nab3 cross-linked regions. The 100 most frequent T-to-C cross-linked sites in each data set were selected for this analysis. A region extending 20 nt in each direction from the cross-linked site was mapped to the genome, and values in the plot represent the number of overlapping or nonoverlapping nucleotides.

