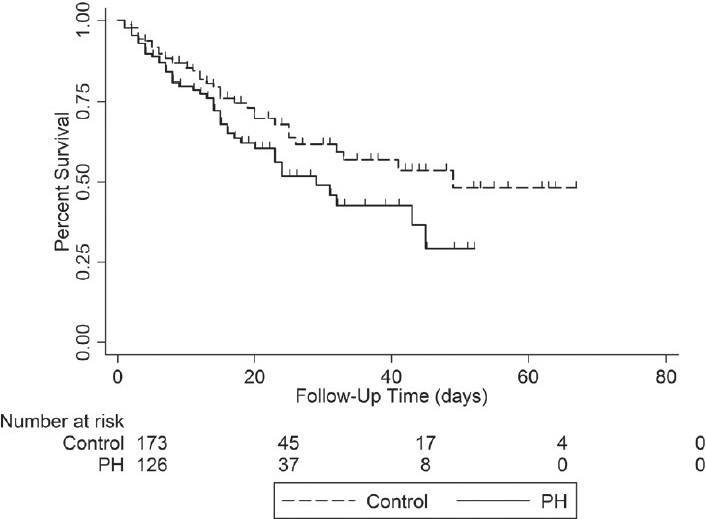
Figure 3.

Kaplan–Meier survival curve of those with (PH) and without (control) Doppler-defined pulmonary hypertension. Log-rank test=0.05. Time of survival calculated as date of intensive care unit admission until death or hospital discharge (censoring)
