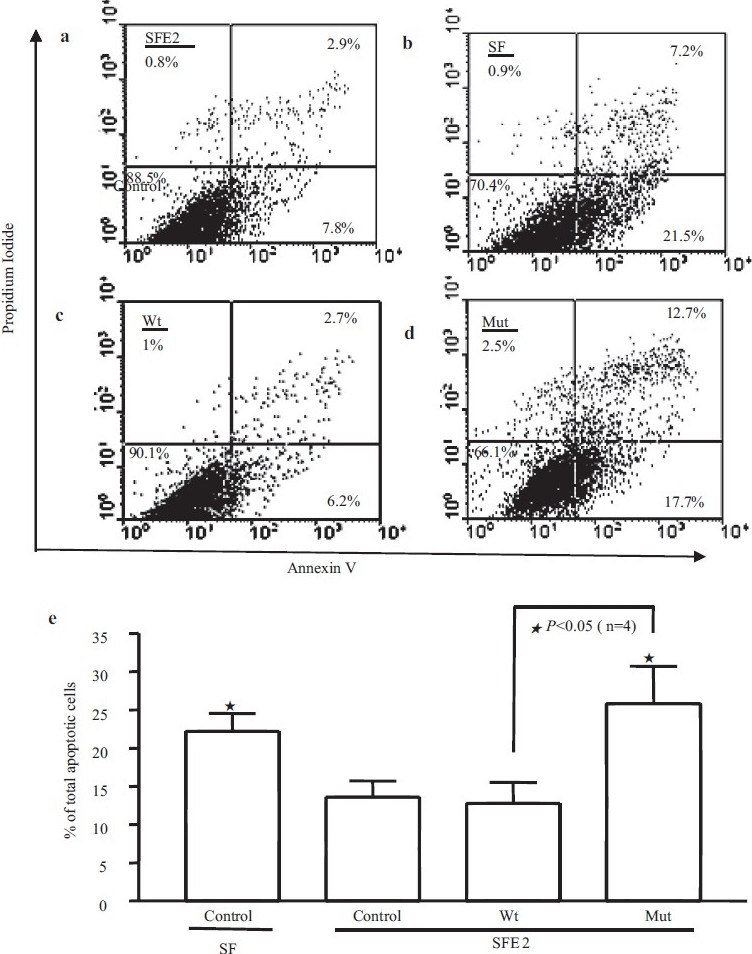
Figure 2.

Apoptosis was further measured by flow cytometric analysis. (a, b, c, and d) Represents scatter plots of propidium iodide (PI) (y-axis) versus Annexin V-FITC (x-axis). Lower left quadrants (absence of both markers) indicate viable cells; upper left quadrants (PI positive) indicate cellular necrosis. The total apoptotic cells (early and late-stage apoptosis) are represented by the right side of the panel (Annexin V staining alone or together with PI) in which the total cell death number from the Mut is significantly higher (25.7±7.1%) than the Wt (12.6±3.2%)(e)
