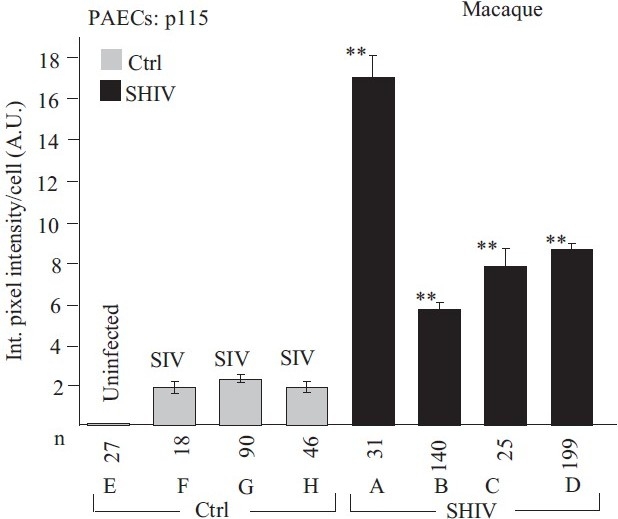
Figure 11.

Quantitative immunomorphometry data for the Golgi tether, p115, in PAECs in SHIV-nef–infected macaques. Integrated pixel intensity/cell was computed using Image J software by outlining individual cells within immunofl uorescence images corresponding to luminal endothelium (PAEC) in sections from each of the control/SIV- and SHIV-infected macaques (n=4 in each group) and was expressed in arbitrary units (A.U.) (mean±SE; n is number of cells quantitated). PAECs in group Ctrl-E had little or no detectable p115. Post-hoc between-group comparisons were carried out using the Tukey–Kramer Multiple Comparison test with an alpha setting of 0.05 (NCSS 2007). Double asterisks indicate that the particular group was different from all control/SIV groups. (Adapted from ref. 2.)
