
Figure 5.
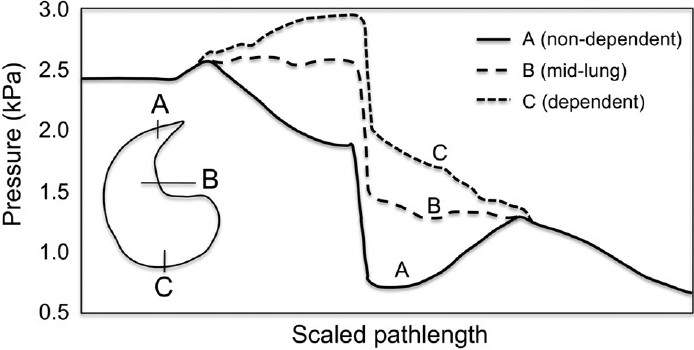
Variation in pathway blood pressure from right to left heart in the full-circuit model. Vertical lines show the capillary bed, where the greatest pressure drop occurs. Results differ substantially from previous models (Fig. 1), which show continuous blood pressure drop. In contrast this illustrates the influence of the hydrostatic pressure gradient, with pathways to non-dependent (A) tissue having decreasing arterial blood pressures and increasing venous pressure, while pathways to the dependent tissue (C) having increasing arterial pressures and decreasing venous pressures.