
Figure 2.
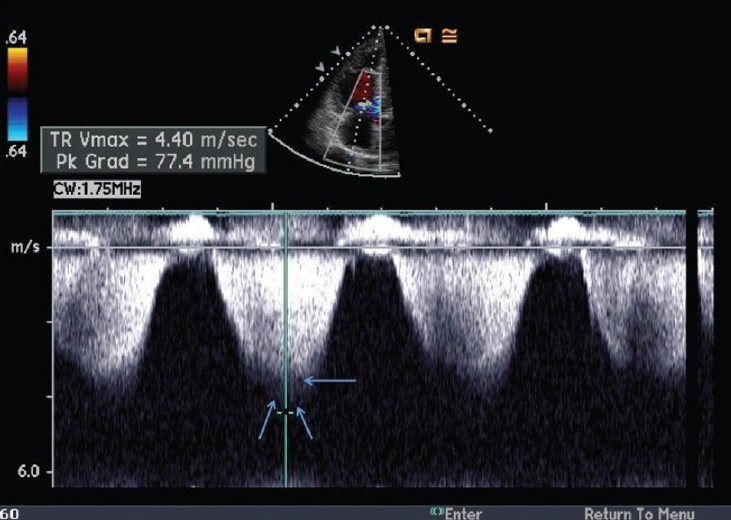
Example of pulmonary artery systolic pressure overestimation by the continuous-wave Doppler method. The reported peak velocity is 4.4 m/s, estimating a gradient between the RV and the RA of 77 mmHg. However, the true peak velocity (b) is only 3.6 m/s, estimating an RV to RA gradient of only 52 mmHg. This figure highlights the importance of measuring the peak velocity carefully, as the peak velocity is squared, thus amplifying the error. Note the true peak Doppler velocity (single arrow) and the ‘shadow’ (double arrow) above the true peak of the Doppler envelope.