
Figure 3.
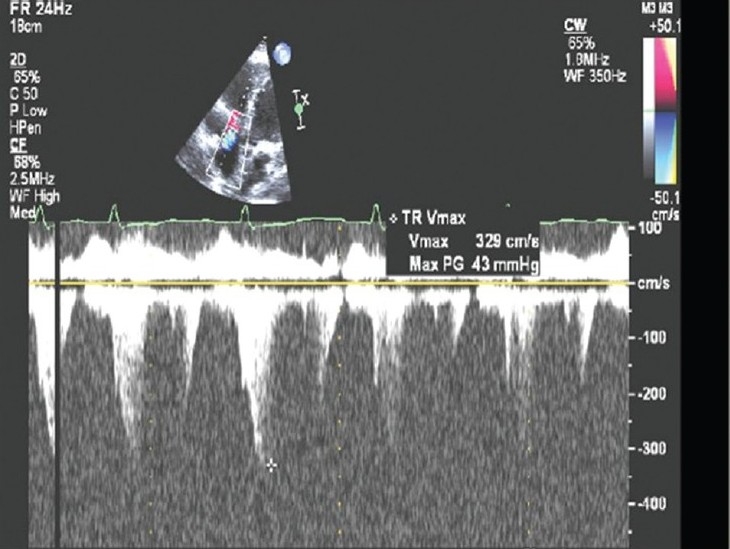
Example of pulmonary artery systolic pressure underestimation by continuous wave Doppler method. Note the Doppler signal dropout and a poorly defined peak TR velocity. The peak velocity is estimated at 3.3 m/sec, estimating an RV to RA gradient of 43mmHg and PA systolic pressure of 53 mmHg. A right heart catheterization within 24 hours of the DE examination revealed a pulmonary artery systolic pressure of 95 mmHg. Note the RV dilation on the above 2-D image; the RV dilatation is an important clue to potential PA systolic pressure underestimation.