
Graphic 1.
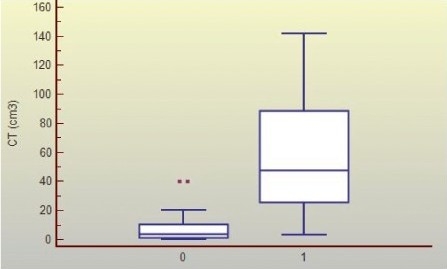
Distribution of Intracerebral Lesion Volume (cm3) in Good and Poor Evolution Groups Legend: Group of patients with a good (0) and poor (1) evolution; (p< 0.0001)
Official websites use .gov
A
.gov website belongs to an official
government organization in the United States.
Secure .gov websites use HTTPS
A lock (
) or https:// means you've safely
connected to the .gov website. Share sensitive
information only on official, secure websites.
Distribution of Intracerebral Lesion Volume (cm3) in Good and Poor Evolution Groups Legend: Group of patients with a good (0) and poor (1) evolution; (p< 0.0001)