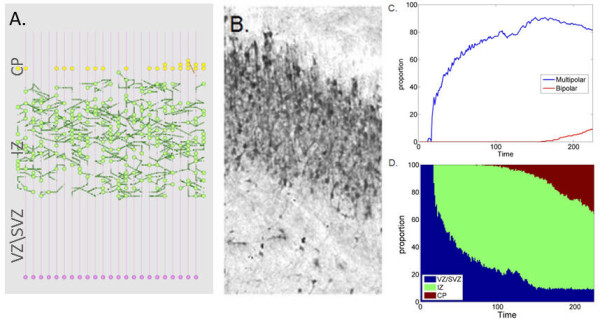
Figure 6.

DCX reduced activity experiment. A. In-silico migration in DCX-defective simulations. B. Histology of neuronal migration in the cortex of rats in DCX RNAi (reproduced with permission from [31]). C. Distribution of multipolar (blue) and bipolar (red) neurons over time (averaged over 10 different simulations). D. Zone occupancy as function of time (VZ/SVZ blue), IZ (green) and CP (red) (averaged over 10 different simulations).
