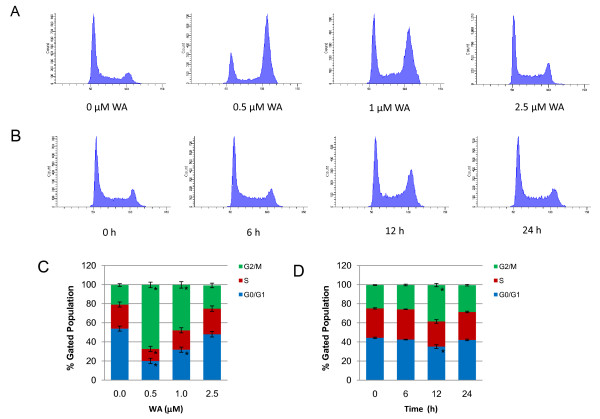
Figure 3.
Effect of WA on MCF-7 cell cycle distribution as measured by propidium iodide flow cytometry. A and C, cells were treated with DMSO or the indicated concentrations of WA for 24 h. B and D, cells were treated with 2.5 μM WA for indicated time periods. Results were presented as mean (n = 3) ± SD. *, P < 0.05, significantly different from control by one-way ANOVA.

