
Figure 1.
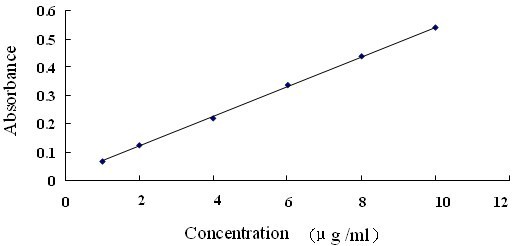
The calibration curve of gallic acid. linear range (1~10 μg/ml), Regression equation(Y = aX + b): y = 52.496x + 0.0163, R2 = 0.9993(n = 6)
Official websites use .gov
A
.gov website belongs to an official
government organization in the United States.
Secure .gov websites use HTTPS
A lock (
) or https:// means you've safely
connected to the .gov website. Share sensitive
information only on official, secure websites.
The calibration curve of gallic acid. linear range (1~10 μg/ml), Regression equation(Y = aX + b): y = 52.496x + 0.0163, R2 = 0.9993(n = 6)