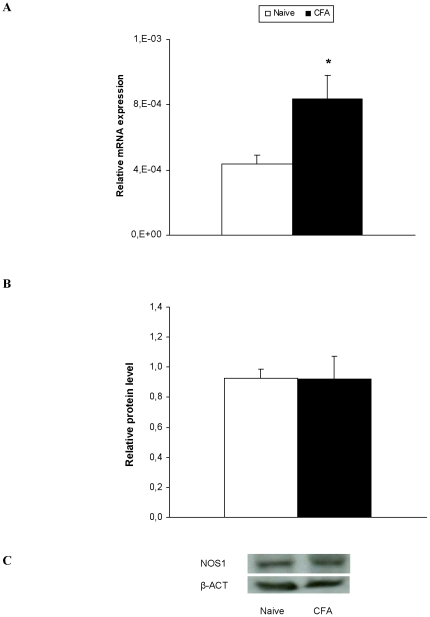
Figure 4. Dorsal root ganglia expression of NOS1.
The relative mRNA (A) and protein (B) expression of NOS1 in the ipsilateral side of the dorsal root ganglia from naive and CFA injected WT mice are represented. A representative example of Western blot for NOS1 protein (155 kDa) in which β-actin (43 kDa) was used as a loading control is shown in C. Data are expressed as the mean values ± SEM of 5–6 samples per group. * indicates significant differences when compared CFA vs. naïve mice (p<0.05, Student's t test).

