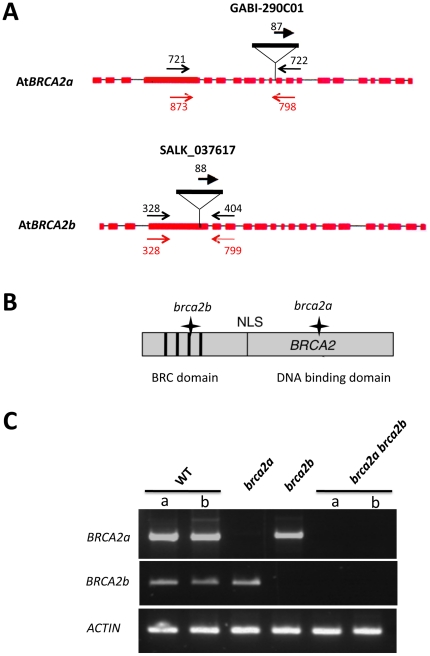
Figure 1. The brca2 single and double mutants.
(A) Position of the T-DNA insertions in AtBRCA2a and AtBRCA2b. The structure of the AtBRCA2a and AtBRCA2b genes is represented by shaded boxes (exons) and thin lines (introns). The T-DNA insertion position is indicated. Each primer pair used to identify the mutants by PCR are compiled on the diagram in black and primer pairs used for RT-PCR analyses are given in red; their localization is correct but not to scale. (B) Schematically represented Brca2 protein with the position of the BRC repeats and the NLS relative to the T-DNA insertions, as indicated by a star. For convenience, and because they share 94.5% of identity, a single Brca2 protein is represented. (C) RT-PCR analysis of AtBRCA2 transcripts in the single and double brca2 mutants. RNA was extracted from young floral buds of wild-type plants (2 different plants, a and b) as well as of brca2a, brca2b and brca2a brca2b (2 different plants, a and b) mutant plants and was then reverse-transcribed. Double-stranded cDNAs were then PCR-amplified using the primer pairs represented in red in Figure 1A. The constitutive ACTIN gene transcript was used as a control.

