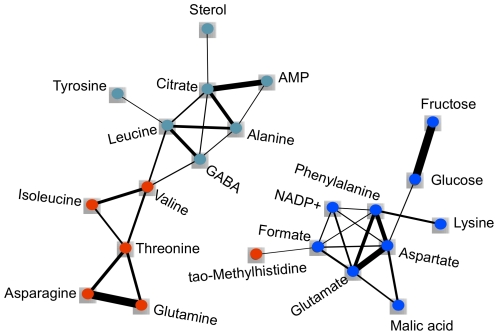
Figure 4. WGCNA of whole tomato fruit metabolic profiles as represented by node and edge graph.
22 of 46 NMR-profiled metabolites were clustered into three modules (red, blue, turquoise); remaining metabolites were not assigned to any module (color coded as gray). Connection strength is represented by edge width (edges <0.10 omitted). The topological overlap measure from the WGCNA was displayed using Cytoscape to illustrate the network assembled from the 22 metabolites.

