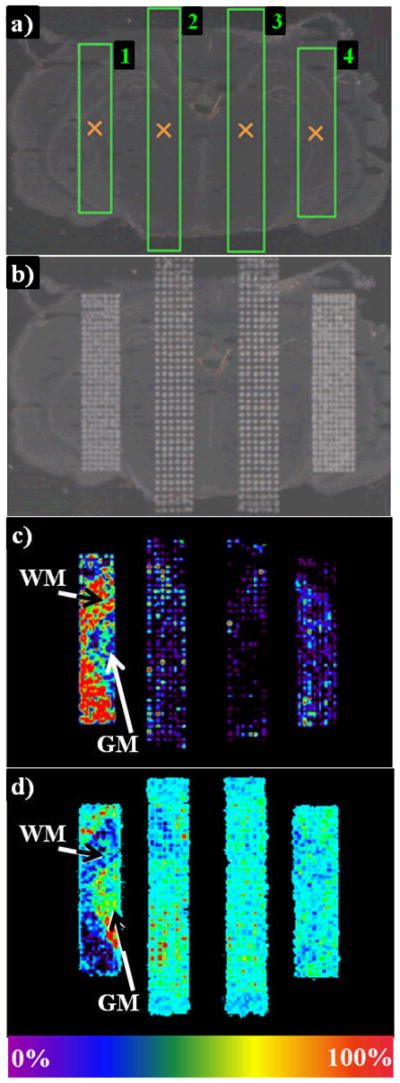
Figure 2. Matrix coating efficiency test as a function of the distance between two spots of matrix and the deposited volume of DHB per spot onto a rat brain section, using the chemical inkjet printer.

a) Four rectangular print areas were delineated on the freshly cut tissue section using the spotter printing software. Areas 1 and 2 received 15nL of matrix solution per spot while areas 3 and 4 received 25nL. In addition, a distance of 200μm was set between two spots center-tocenter for areas 1 and 4 versus 250μm for areas 2 and 3. After matrix microprinting b), a MALDI image was acquired. c) PC 32:0+K (m/z 770) and d) PC 38a:4+K (m/z 848) localization in white (WM) and grey matter (GM), respectively, highlights differences in the efficiency of the matrix volume and the raster used in each area.
