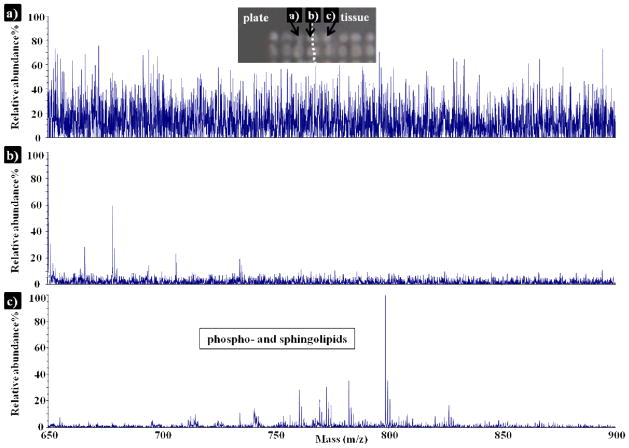
Figure 4.
Positive ion mode MALDI mass spectra of phospho- and sphingolipids detected in a rat brain section, using 15nL/spot of 30mg/mL DHB, and a spot center-to-center distance of 200μm. Mass spectra were collected from matrix spots a) onto the MALDI plate, b) at the edge of the tissue and c) onto the tissue.

