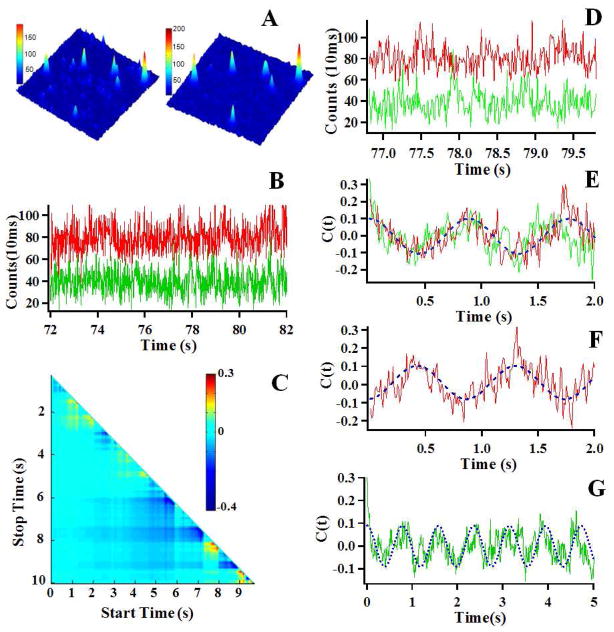
Figure 2.
(A) Single molecule fluorescence images (10μm×10μm) of Cy3 and Cy5 labeled HPPK in the presence of 100 μM ATP and 100 μM HP. The emission is from the Cy3 (Left) and Cy5 (Right) dyes attached to the HPPK enzyme. (B) A part of the single-molecule intensity-time trajectories of the donor (Cy3, Green) and acceptor (Cy5, Red) labeled on HPPK in the presence of 100 μM ATP and 100 μM HP. (C) The result of TCAD analysis on the single-molecule donor-acceptor fluorescence intensity trajectories shown in 2B. The cold color represents that the D-A is anti-correlated, whereas the warm color represents that the D-A is correlated. (D) A part of the single-molecule intensity-time trajectories of the donor and acceptor from the long trajectories shown in 2B, the anti-correlated fluctuation features are evident. (E) Autocorrelation functions (C(t)AA and C(t)DD) of the donor (Green) and the acceptor (Red) from the single-molecule intensity-time trajectories shown in 2D, the fitted (blue) oscillatory frequency is 1.2±0.1 s−1 (F) Cross-correlation function (C(t)AD) from the single-molecule intensity-time trajectories shown in 2D, the fitted (blue) coherence frequency is 1.2±0.1 s−1, the same as C(t)AA and C(t)DD. The result of the same decay rates of the three correlation functions calculated from the single-molecule D-A single time trajectories indicates that the fluctuation dynamics is originated from the same origin, i.e., single-molecule FRET fluctuations associated with conformational change fluctuations of HPPK. (G) Autocorrelation C(t)DD) of the donor (Green) from the single molecule intensity-time trajectories shown in 2B, dephasing appears in ~4.5 seconds.

