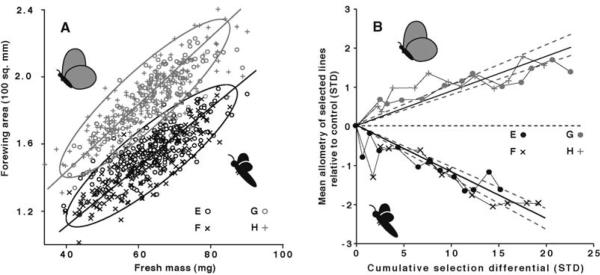
Fig. 2.
Scatterplots of static allometries of individuals from lineages selected for changes in FW/BS and the evolution of the mean allometry. (A) Phenotype distributions of lineages selected for changes in forewing–body size scaling. Each selected population is shown as a different symbol; replicates of a selection direction have the same shading. The mean allometry of each selected direction (replicates combined) is shown as the model II regression through the points and is enclosed by a 95% confidence ellipse. (B) Realized heritabilities of the mean allometries. Mean phenotype (through which the mean allometry passes) for each lineage is shown relative to control values (horizontal dashed line) as a function of the cumulative selection differential. Mean heritabilities (+FW/−HW 0 0.18; −FW/+HW 0 0.24) are equal to twice the slope of the regressions fit to each selected direction (95% confidence intervals shown by dashed lines). Target phenotypes are represented by cartoons in both panels.

