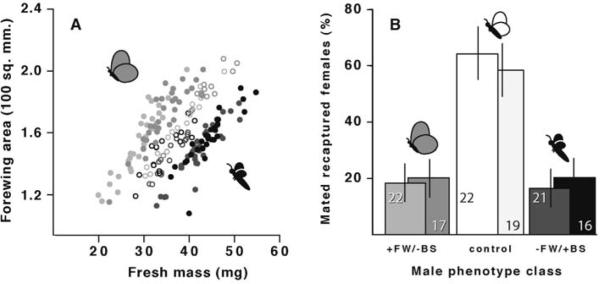
Fig. 4.
Distributions of static allometries for FW/BS allometries and relative mating success of three male phenotype classes. (A) Distributions of individual males with +FW/−BM, wild type, and +FW/−BM phenotypes included in the experiment (extreme phenotypes are represented by cartoons). Solid circles denote novel phenotype classes; open circles denote wild-type controls. (B) Mating success of each phenotype class. Columns indicate percentage of recaptured females that mated with males in each class and are shown with 95% confidence intervals based on a bimodal distribution. Numbers in the columns indicate the number of males recaptured in each group. Data from replicate trials are indicated by similar shading (shared between panels).

