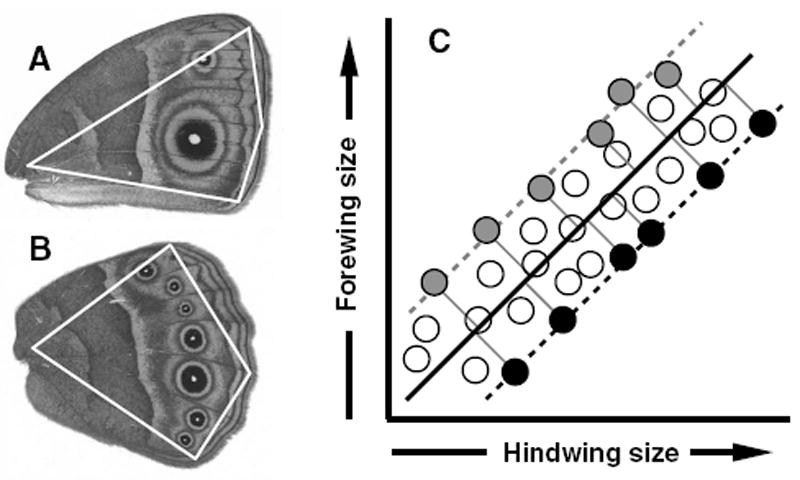
Figure 1.

Methodology for estimation of wing areas and artificial selection on allometry intercepts. A and B, the right ventral views of fore- and hindwings of B. anynana, respectively. Wing sizes were estimated by calculating the area within the polygons (white lines), defined by four landmarks (vertices of polygons). (C) Selection for individuals with the most extreme FW/HW phenotypes. The dark solid line represents the static allometry describing the forewing–hindwing scaling relationship for this hypothetical population. Perpendicular deviations from this allometry are shown for the six most extreme observations in each direction as thin solid lines that connect to +FW/−HW phenotypes (gray circles) or −FW/+HW phenotypes (black circles). Static allometries for these subpopulations of individuals that would be selected in each direction are shown as gray or black dashed lines, respectively. Because this methodology selects individuals from across the full range of wing sizes, the expectation is that only the allometry intercept (not the slope) will respond to selection.
