
Figure 2.
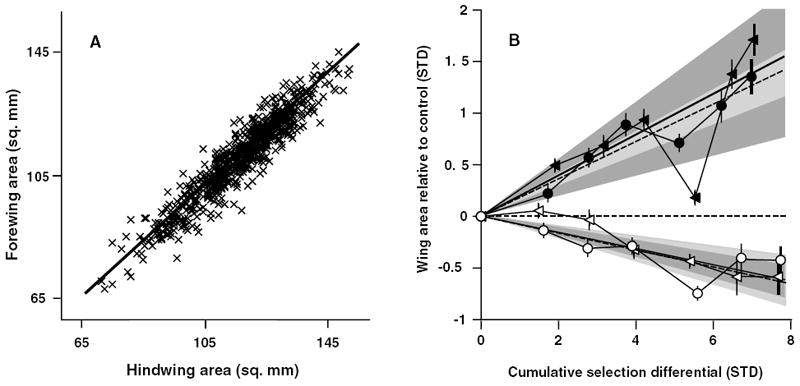
Forewing–hindwing static allometry and the evolution of absolute wing areas. (A) The static allometries for FW and HW for several hundred stock females. (B) The response to selection of females selected for increased (filled) or decreased (open) FW (triangles) and HW (circles) areas. Lineage means ± 2 SE are shown relative to the control-lineage mean (horizontal dashed line). Realized heritabilities for FW and HW are shown as solid and dashed lines, respectively. Dark gray regions represent 95% confidence intervals around the realized FW heritabilities and lighter gray regions show confidence intervals around HW heritabilities; these are for the slope of the regression only as the intercept was forced through the origin. Cumulative selection differentials are shown as absolute values to facilitate comparison between selected directions.