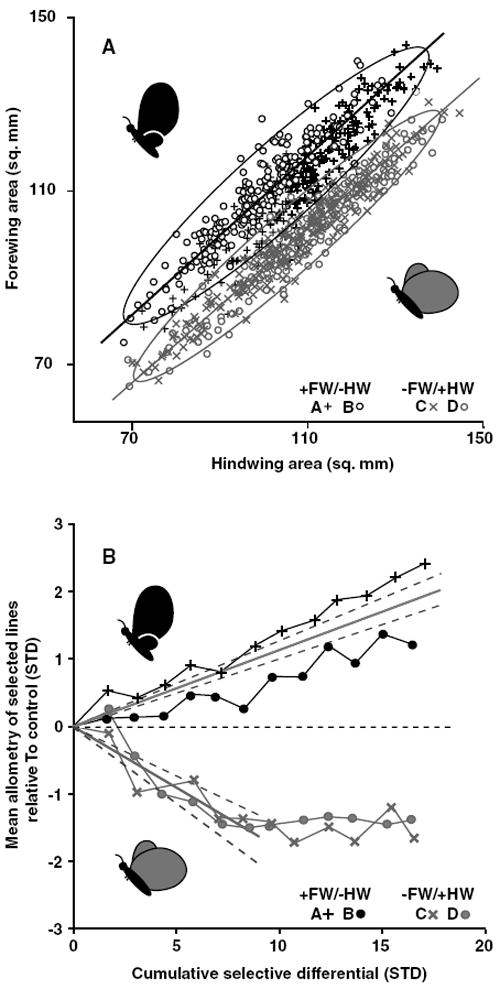
Figure 3.

Forewing–hindwing allometries after 12 generations of artificial selection and evolution of allometry intercepts. (A) The phenotype distributions of lineages selected for changes in forewing–hindwing scaling. Each selected population is shown as a different symbol, replicates of a selection direction share colors. The static allometry of each selected direction (replicates combined) is shown as the orthogonal regression through the points and are enclosed by 95% confidence ellipses. (B) Realized heritabilities of the allometry intercepts. Bivariate mean phenotype (through which the allometry of each replicate passes) is shown relative to control value (horizontal dashed line) as a function of the absolute value of the cumulative selection differential. Mean heritabilities (solid gray lines) are fitted to each selected direction and are bordered by 95% confidence intervals (gray dashed lines). Note that heritability of the allometry is calculated only through generation six for the −FW/+HW direction because of a cessation in the response to selection around that point. Target phenotypes are represented by cartoons in both panels.
