
Figure 5.
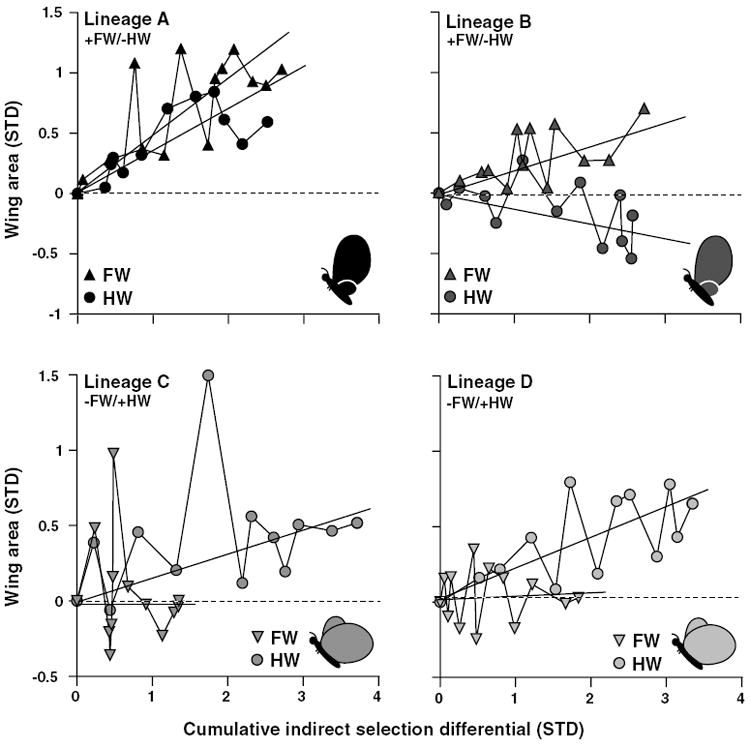
Indirect response to selection for each replicate of the allometry-intercept selected lineages. Mean forewing (FW) and hindwing (HW) areas relative to control values (dashed line) as a function of the absolute value of the cumulative indirect selection on each trait. Mean indirect response of each trait is shown by individual regressions for that trait over the absolute value of the cumulative indirect selection differential. Cartoons represent the selected target phenotypes.