
Figure 3.
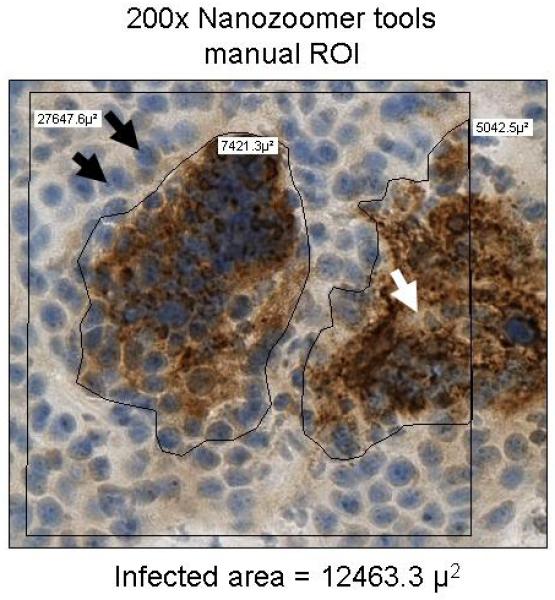
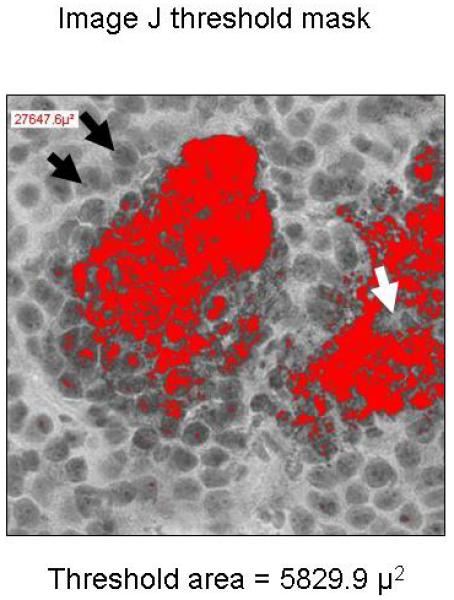
Comparison of Manual Region-of-Interest Analysis and Automated Threshold Pixel Analysis. Images of immunohistochemically stained sections of 5 MV-NIS–infected tumors were quantified manually with region-of-interest analysis (A) or automated threshold pixel analysis (B). The mean recovery coefficient of the automated analysis for 10 randomly selected images (mean 0.396 ± 0.09 × the manual ROI) was used to correct for nonuniformity of staining within MV-NIS–infected syncytia. Black arrows show nucleoli used to establish the image threshold; the white arrow denotes a region in the center of a syncytium that is weakly stained and below the designated threshold. MV-NIS denotes measles virus expressing sodium iodide symporter.