
Figure 7.
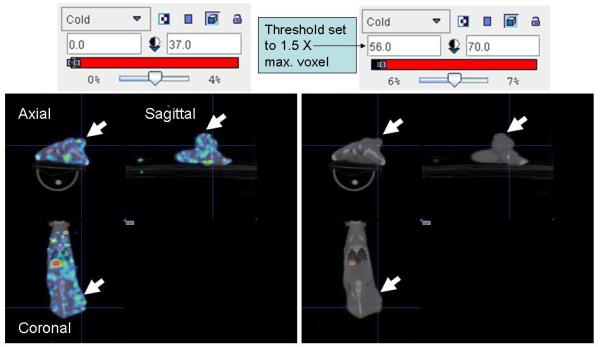
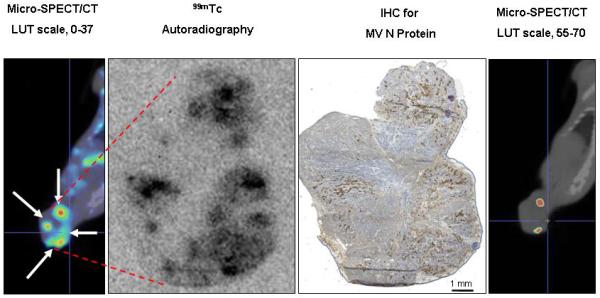
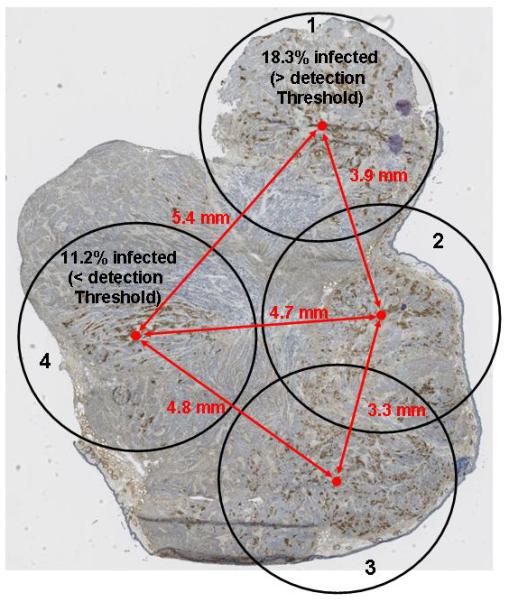
Sensitivity of Pinhole Micro-SPECT/CT for Detection of Separate Intratumoral Foci of MV-NIS Infection. A, Control BxPC-3 tumors (without MV-NIS infection) showed background 99mTcO4 localization (maximal pixel intensity, 37). A threshold 1.5-fold higher than the maximal background intensity (threshold value, 56) was applied to avoid false-positives. Note that the threshold-adjusted image on the right no longer shows background radioactivity. B, Example of a tumor from a mouse euthanized 4 days after MV-NIS injection. Far left panel, Coronal micro-SPECT/CT image. Arrows indicate sites of tumor injection. Middle left panel, Autoradiogram. Middle right panel, IHC stain of the same tumor section. Far right panel, Threshold-adjusted micro-SPECT/CT image. The in vivo micro-SPECT/CT and ex vivo autoradiography and IHC showed excellent spatial correlation. Note that 2 of the 4 injection points (seen as regions of high intensity on micro-SPECT/CT, far left panel) had radionuclide levels exceeding the 1.5-fold background threshold (far right panel). C, IHC tumor section shows the 4 injection zones (4.5-mm circles), which corresponded to 3 times the full-width, half-maximal spatial resolution of the imaging equipment. Quantitative IHC was used to calculate the percent of infected BxPC-3 cells in injection zones 1 and 4. The same experiment on a total of 7 injection sites from 5 tumors revealed a mean of 12.85%+/−1.7 % infected BxPC-3 cells per injection site. IHC denotes immunohistochemical stain; LUT, lookup table; SPECT/CT, single-photon emission computed tomography/computed tomography; MV, measles virus; MV-NIS, measles virus expressing sodium iodide symporter.